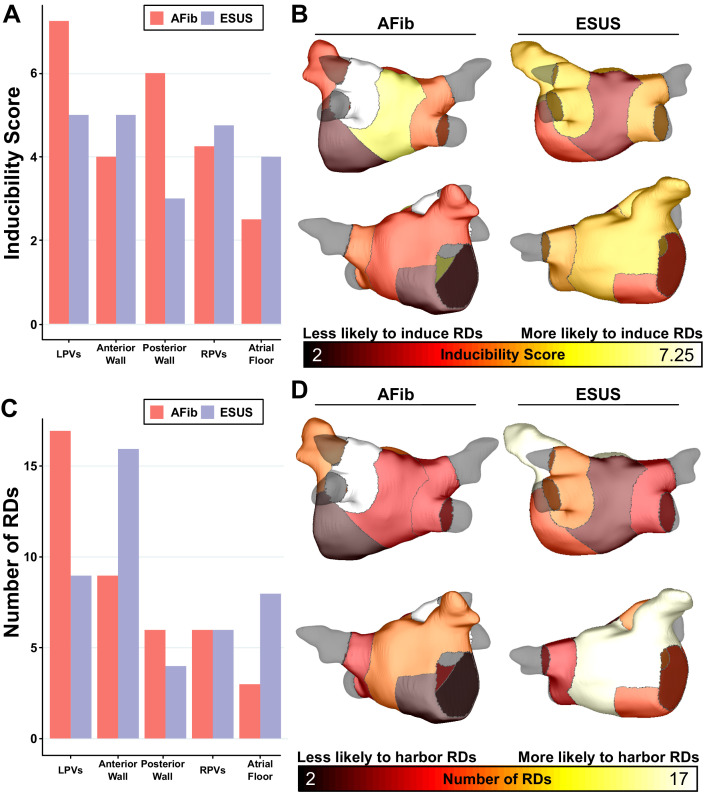
Figure 5. Summary of IdS and RD localization characteristics.
(A) Region-wise IdS for both ESUS and AFib LA models. (B) Heat map of the regions in which triggers are most likely to induce arrhythmias depicted as representative ESUS and AFib models. (C) Histogram of RDs across all AFib and ESUS models binned by localization to specific LA regions. (D) Heat map of regions in which RDs are most likely to localize depicted as representative ESUS and AFib models.

