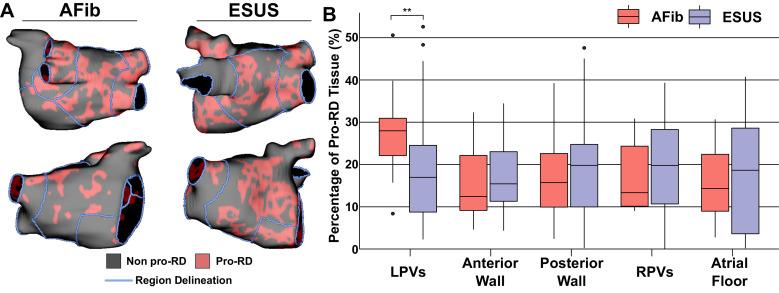
Figure 6. Summary of the region-by-region extent of tissue with a spatial fibrosis pattern (as characterized by local density and entropy) associated with RD localization (i.e., pro-RD tissue).
(A) Maps of pro-RD tissue for representative AFib and ESUS cases, including boundaries between regions. (B) Region-wise extent of pro-RD tissue in inducible AFib and ESUS models, depicted as boxplots (**p<0.01, Wilcoxon rank-sum test; CI: [–0.149, –0.021]).

