. 2021 Apr 29;10:e62857. doi: 10.7554/eLife.62857

Figure 1. YAP-TFE3 transforms cells in vitro and in vivo and combines properties of both YAP and TFE3.

(A) Structure of full-length TAZ, CAMTA1, TAZ-CAMTA1 (TC), YAP, TFE3, YAP-TFE3 (YT), truncated portion of YAP (YAP trunc) and the truncated portion of TFE3 (TFE3 trunc). (B) Soft agar assay in NIH 3T3 cells transduced with empty vector (EV), full-length YAP, YAP trunc, TFE3, TFE3 trunc, and YAP-TFE3. (C) Poly-HEMA proliferation assay in NIH 3T3 cells (same constructs as part B). (D) Poly-HEMA proliferation assay in SW872 cells (same constructs as part B). (E) Immunofluorescence images in NIH 3T3 cells expressing YAP, YAP-TFE3, and TFE3 during sparse and confluent conditions, represented graphically (% nuclear positivity during cell confluence is normalized to % positivity in sparse conditions) in (F). (G) Overall survival curve for NSG mice containing xenografted NIH 3T3 cells transduced with empty vector (EV), YAP-TFE3 (YT), and TAZ-CAMTA1 (TC). (H) Tumor growth curve for NSG mice containing xenografted NIH 3T3 cells transduced with empty vector (EV), YAP-TFE3 (YT), and TAZ-CAMTA1 (TC). (I) Gross and microscopic pathology of pulmonary metastases derived from NIH 3T3 cells derived tumors expressing YAP-TFE3. Graphically represented on the right. (J) Tumor growth curve for NSG mice containing xenografted SW872 cells transduced with empty vector (EV), YAP-TFE3 (YT), and TAZ-CAMTA1 (TC). For soft agar assays, statistical significance was evaluated using an unpaired two-tailed t-test. For poly-HEMA proliferation assays, statistical significance was evaluated using fold change increase in proliferation at day 10 with an unpaired two-tailed t-test. For immunofluorescence, % nuclear positivity was calculated for six different fields for each condition; statistical significance was evaluated using an unpaired two-tailed t-test. All in vitro assays were repeated at least twice. Xenograft mouse experiments were repeated twice, using 5–10 mice per group; statistical significance was evaluated using an unpaired two-tailed t-test for evaluation of metastasis and difference in primary tumor size (last day evaluated). Approximately equal numbers of male and female mice were used. Statistical analysis for Kaplan-Meier survival analysis was performed with the log-rank (Mantel-Cox) test. Error bars were used to define one standard deviation. For all panels, ****p<0.0001, ***p<0.001, **p<0.01, *p<0.05.

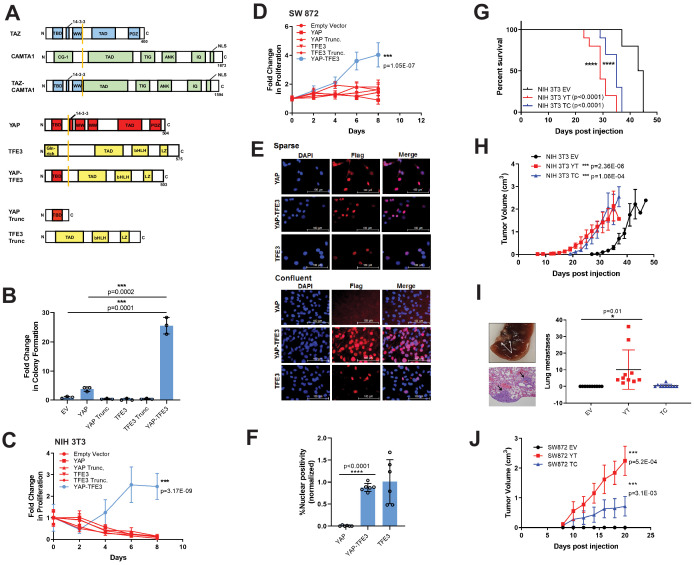
Figure 1.

Figure 1—figure supplement 1. YAP-TFE3, TAZ-CAMTA1, and controls are expressed in NIH 3T3 cells, SW 872 cells, and HEK293 cells.

Figure 1—figure supplement 1.

(A) Western blot for Flag tagged YAP5SA, YAP-TFE3, TFE3, TAZ4SA, TAZ-CAMTA1, CAMTA1 in NIH 3T3 cells (B) Western blot for Flag-tagged YAP, YAP-TFE3 S94A, YAP S94A, YAP-Trunc, and TFE3-Trunc in NIH 3T3 cells. (C) Western blot for Flag-tagged TAZ4SA, YAP5SA, YAP-TFE3, TFE3, TAZ-CAMTA1, CAMTA1 in SW872 cells (D) Western blot for Flag tagged YAP-TFE3 S94A, YAP, YAP-Trunc, and TFE3-Trunc in SW872 cells. (E) Western blots for Flag-tagged YAP-TFE3, YAP-TFE3 S94A, and TAZ-CAMTA1 in HEK293 cells. Each blot (excluding NIH 3T3 CAMTA1, (A)) was run on a single gel, respectively. * indicates protein band of interest, † indicates longer exposure, # indicates shorter exposure, †† 100 ug protein loaded.
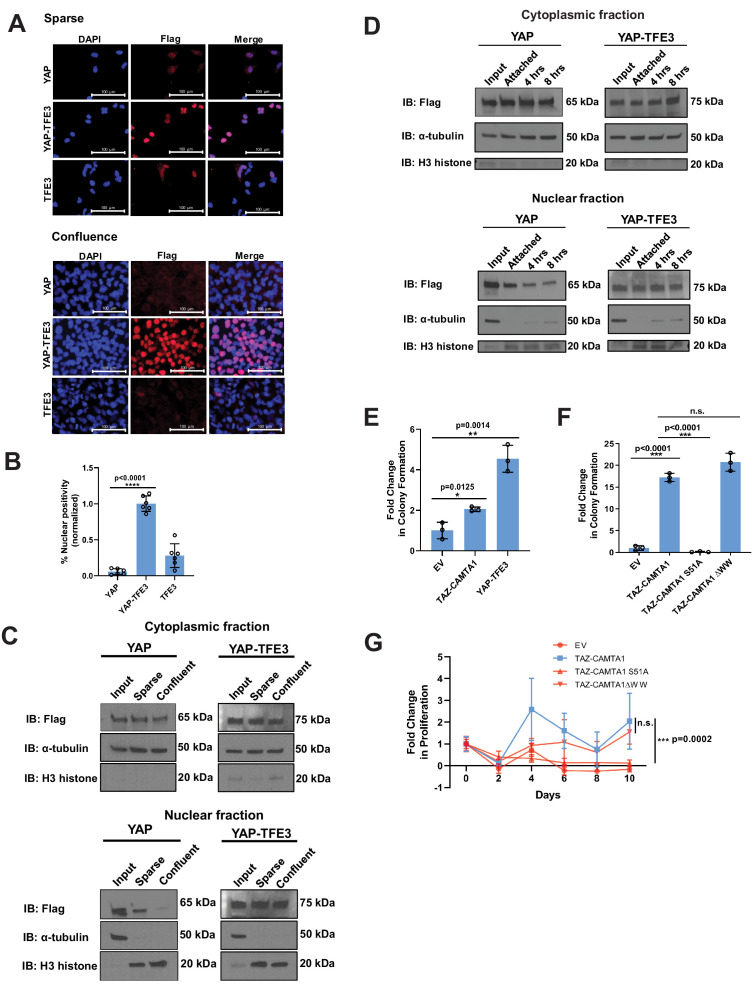
Figure 1—figure supplement 2. YAP-TFE3 is not regulated by the Hippo pathway and required binding to TEAD transcription factors to drive its oncogenic transcriptional program.

Figure 1—figure supplement 2.

(A) YAP and YAP-TFE3 are localized within the nucleus under spare conditions in SW872 cells. YAP-TFE3 but not YAP is localized within the nucleus under confluent conditions in SW872 cells. (B) Graphical representation of results in part (A) with % nuclear positivity during cell confluence normalized to % nuclear positivity during sparse conditions. (C) NIH 3T3 cells expressing YAP and YAP-TFE3 are plated under sparse and confluent conditions. YAP accumulation in the nucleus is diminished during confluence while YAP-TFE3 levels in the nucleus remain constant. α-tubulin is the cytoplasmic loading control; H3 histone is the nuclear loading control. (D) NIH 3T3 cells are detached in a time course. Nuclear:cytoplasmic fractionation show YAP-TFE3 remains in the nucleus during detachment while YAP localization in the nucleus diminishes with time. (E) TAZ-CAMTA1 and YAP-TFE3 promote anchorage independent growth in SW872 cells in soft agar colony formation assay. (F) The TAZ-CAMTA1 S51A mutant (TEAD binding domain mutant) abrogates colony formation in soft agar in NIH 3T3 cells. Mutating the WW domain in TAZ-CAMTA1 (TAZ-CAMTA1 ΔWW mutant) does not reduce colony formation in soft agar. (G) The TAZ-CAMTA1 S51A mutant but not the ΔWW mutant reduces anchorage independent proliferation on poly-HEMA. For immunofluorescence, % nuclear positivity was calculated for six different fields for each condition; statistical significance was evaluated using an unpaired two-tailed t-test. For soft agar assays, statistical significance was evaluated using an unpaired two-tailed t-test. For poly-HEMA proliferation assays, statistical significance was evaluated using fold change increase in proliferation at day 10 with an unpaired two-tailed t-test. Each experiment was repeated at least twice. Error bars were used to define one standard deviation. For all panels, ****p<0.0001, ***p<0.001, **p<0.01, *p<0.05.
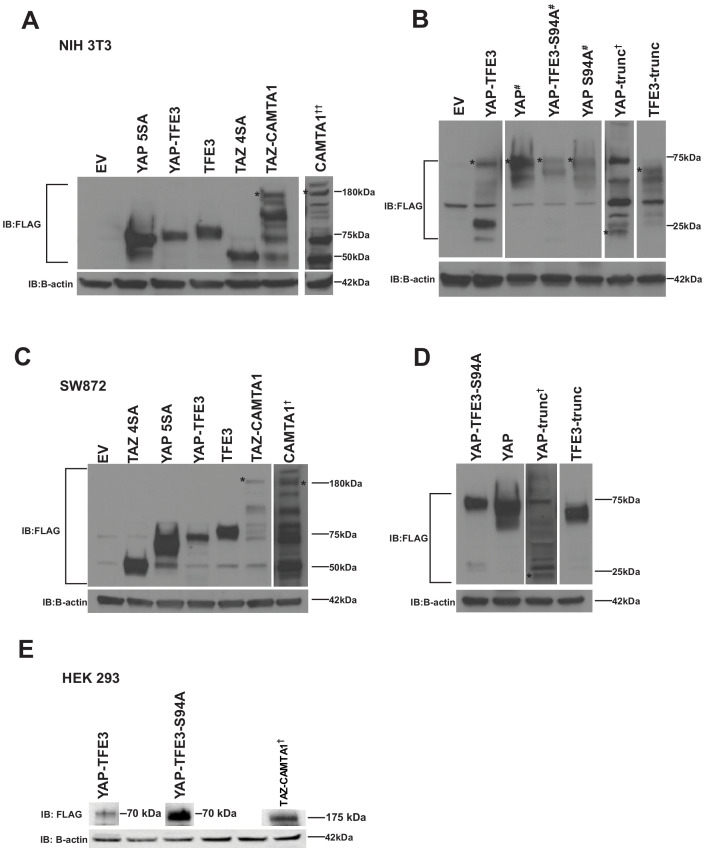
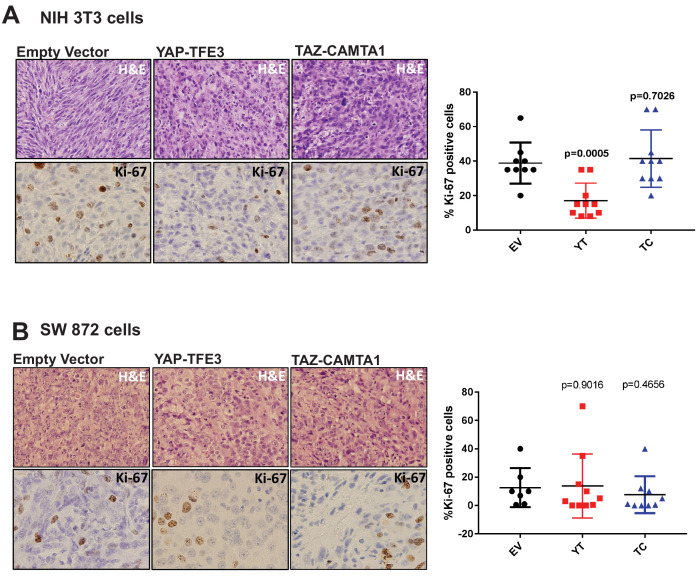
Figure 1—figure supplement 3. YAP-TFE3 and TAZ-CAMTA1 driven xenografts in NOD.Cg-PrkdcscidIl2rgtm1Wjl/SzJ (NSG) mice form tumors in vivo.

Figure 1—figure supplement 3.

(A) H and E sections of NIH 3T3 xenografts transduced with EV, YAP-TFE3 or TAZ-CAMTA1. Tumors expressing YAP-TFE3 or TAZ-CAMTA1 showed a more epithelioid cytomorphology and a greater degree of pleomorphism than EV control. Ki-67 labeling was not increased in YAP-TFE3 or TAZ-CAMTA1 tumors compared to EV. (B) H and E sections of SW872 xenografts transduced with EV, YAP-TFE3, or TAZ-CAMTA1. Tumors expressing YAP-TFE3 or TAZ-CAMTA1 showed a greater degree of pleomorphism, however this change was less pronounced than it was in NIH 3T3 cells. Ki-67 labeling was not increased in YAP-TFE3 or TAZ-CAMTA1 tumors compared to EV. Xenograft mouse experiments were repeated twice, using 5–10 mice per group. Significance of Ki-67 labeling was determine by unpaired two-tailed t-test.