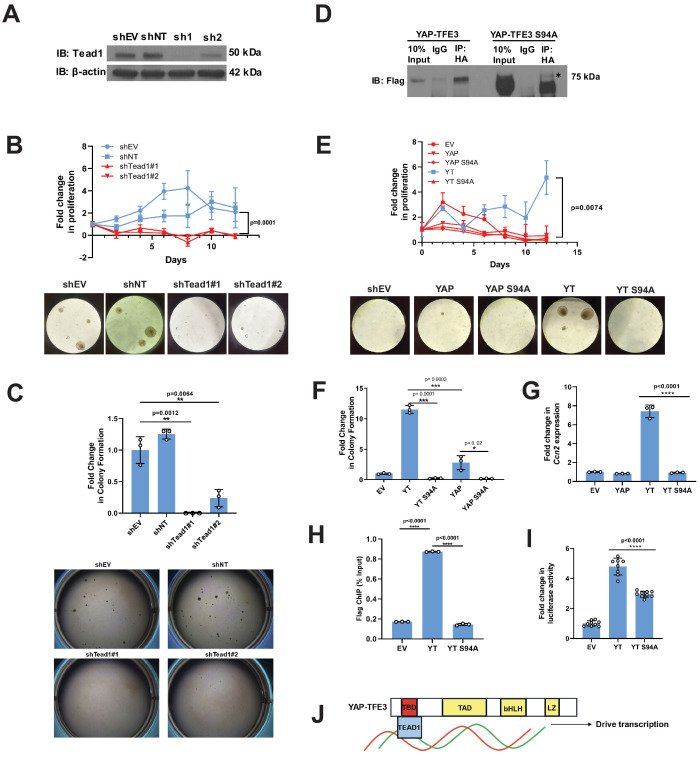
Figure 2. Tead1 mediates the oncogenic transcriptional program of YAP-TFE3.
(A) Knockdown of Tead1 in NIH 3T3 YAP-TFE3 cells. (B) Poly-HEMA analysis in NIH 3T3 YAP-TFE3 cells with Tead1 knock-down. Spheroid formation on poly-HEMA is shown below. (C) Soft agar assay in NIH 3T3 YAP-TFE3 cells with two Tead1 shRNA (shTead#1 and shTead#2) with colonies shown below. (D) Co-immunoprecipitation experiment in NIH 3T3 cells stably expressing Flag-YAP-TFE3 or Flag-YAP-TFE3 S94A. 3HA-TEAD1 is transiently transfected. * indicates MW of Flag-YAP-TFE3. (E) Poly-HEMA assay in NIH 3T3 cells expressing same constructs present in E. Spheroid formation on poly-HEMA is shown below. (F) Soft agar assay in NIH 3T3 cells expressing YAP-TFE3 (YT), YT S94A, YAP, or YAPS94A. (G) Quantitative RT-PCR showing reduced Ccn2 expression in NIH 3T3 YAP-TFE3 (YT) S94A cells. (H) Chromatin immunoprecipitation-quantitative PCR for the CCN2 promoter in SW872 cells transduced with empty vector (EV), YT, and YT S94A. (I) Luciferase reporter assay (8XGTIIC luciferase reporter construct) in HEK 293 cells expressing YT or YT S94A. (J) Model diagram of YAP-TFE3 driving transcription by binding to TEAD1. For soft agar assays, statistical significance was evaluated using an unpaired two-tailed t-test. For poly-HEMA proliferation assays, statistical significance was evaluated using fold change increase in proliferation at day 10 with an unpaired two-tailed t-test. For quantitative RT-PCR and the luciferase reporter assay, standard deviation was calculated from fold change values for each triplicate. Each experiment was repeated at least twice. Error bars were used to define one standard deviation. For all panels, ****p<0.0001, ***p<0.001, **p<0.01, *p<0.05.

