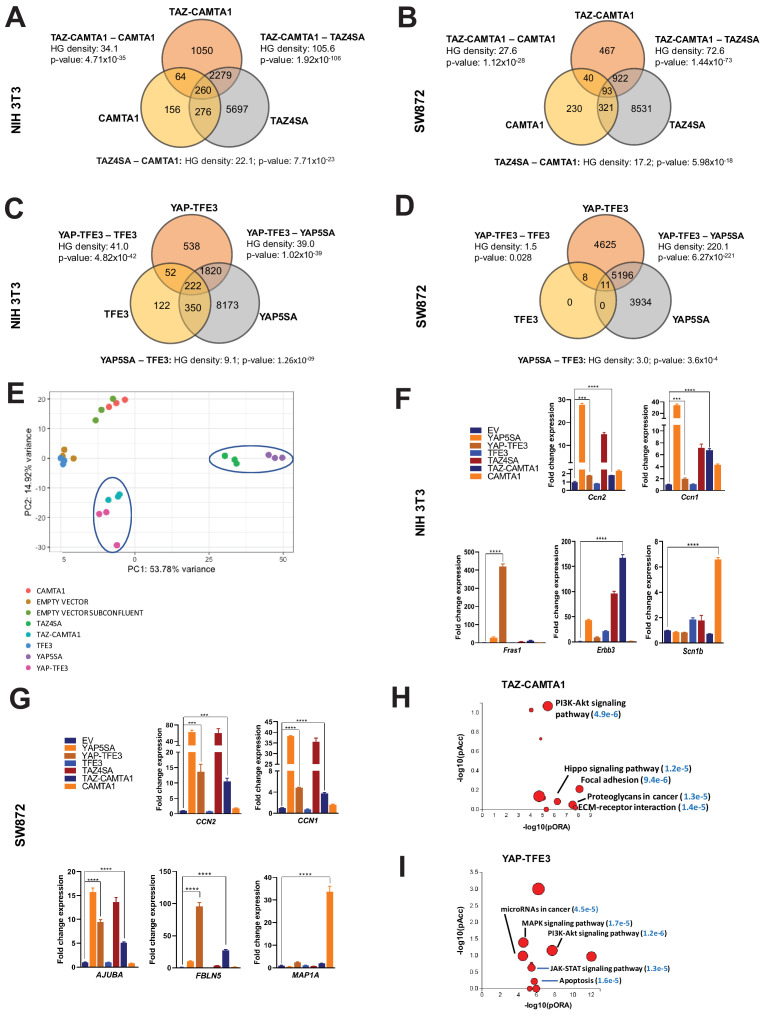
Figure 3. TAZ-CAMTA1 and YAP-TFE3 induce different but overlapping transcriptomes compared to TAZ and YAP.
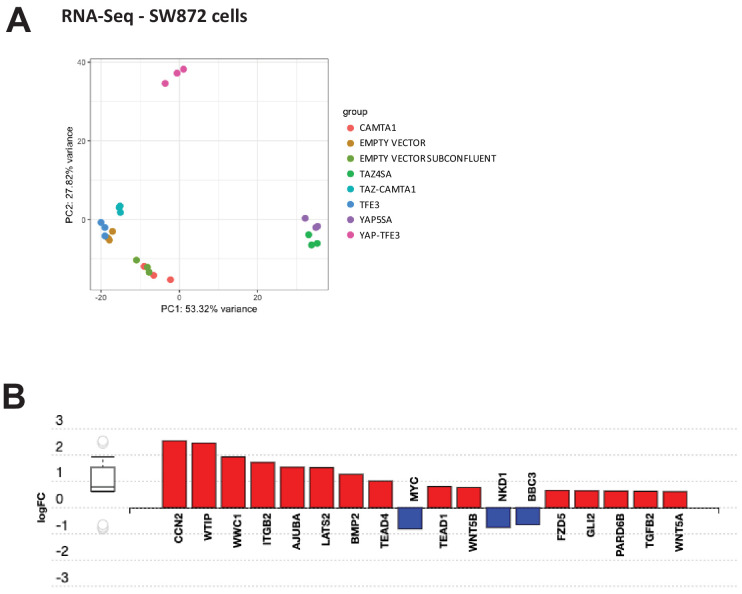
(A) Number of differentially expressed genes (FDR = 5%) in NIH 3T3 cells expressing TAZ-CAMTA1 and full-length controls. HG density represents the –log10(hypergeometric density). p Value for hypergeometric analysis included. (B) Number of differentially expressed genes (FDR = 5%) in SW872 cells expressing TAZ-CAMTA1 and full-length controls. (C) Number of differentially expressed genes (FDR = 5%) in NIH 3T3 cells expressing YAP-TFE3 and full-length controls. (D) Number of differentially expressed genes (FDR = 5%) in SW872 cells expressing YAP-TFE3 and full-length controls. (E) Principal component analysis of RNA expression after variance-stabilizing transformation in NIH 3T3 cells. (F) Validation of RNA-Seq in NIH 3T3 cells by qRT-PCR for key genes. (G) Validation of RNA-Seq in SW872 cells by qRT-PCR for key genes. (H) Scatter plot of two types of pathway enrichment evidence: probability of over-representation (pORA) and probability of accumulation (pAcc) as calculated by iPathwayGuide for SW872 TAZ-CAMTA1 cells and (I) YAP-TFE3 cells. RNA-Seq experiments in NIH 3T3 cells and SW872 cells were performed using biological triplicates for each of the conditions (expression constructs). For gene expression data, the population was set to the total number of recovered genes with the mean of 5 counts across all samples. Hypergeometric testing was performed using the phyper() function in the stats R package (v3.6.3) set to assess enrichment and the lower tail set to false. Hypergeometric density was calculated using the related dhyper function and converted using the negative log10 of the output. For quantitative RT-PCR, standard deviation was calculated from fold change values for each triplicate. Error bars were used to define one standard deviation. For all panels, ****p<0.0001, ***p<0.001, **p<0.01, *p<0.05.


