. 2021 Apr 29;10:e62857. doi: 10.7554/eLife.62857

Figure 4. TAZ-CAMTA1 and YAP-TFE3 occupy TEAD and non-TEAD transcription factor motifs.

(A) Heat map of ChIP binding to transcriptional start site (TSS) regions and average TSS profile histogram for TAZ-CAMTA1 and controls. (B) Heat map and histogram for YAP-TFE3 and controls. (C) Distribution of transcription factor binding loci relative to TSS for the fusion proteins and controls. (D) Distribution of overlapping TAZ-CAMTA1 and H3K27ac ChIP peaks among annotated functional DNA-binding sites. (E) Distribution of overlapping YAP-TFE3 and H3K27ac ChIP peaks among annotated functional DNA binding sites. (F) Intersection of gene annotations for TAZ-CAMTA1 ChIP peaks and controls. Proportion of peaks containing selected transcription factor (TF) motifs (consensus sequences included) shown for each construct below. HG density represents the –log10(hypergeometric density). (G) Intersection of gene annotations for YAP-TFE3 ChIP peaks and controls. Proportion of peaks containing selected TF motifs shown for each construct below. (H) Validation of ChIP-Seq in SW872 cells in selected genes by ChIP-qPCR. ChIP-Seq experiments in SW872 cells were performed using biological triplicates for each of the conditions (expression constructs). For ChIP-Seq analysis, the population was set as the total number of genes annotated across all conditions. Hypergeometric testing was performed using the phyper() function in the stats R package (v3.6.3) set to assess enrichment and the lower tail set to false. Hypergeometric density was calculated using the related dhyper function and converted using the negative log10 of the output. For ChIP-qPCR, standard deviation was calculated from fold change values for each triplicate. Error bars were used to define one standard deviation. For all panels, ****p<0.0001, ***p<0.001, **p<0.01, *p<0.05.

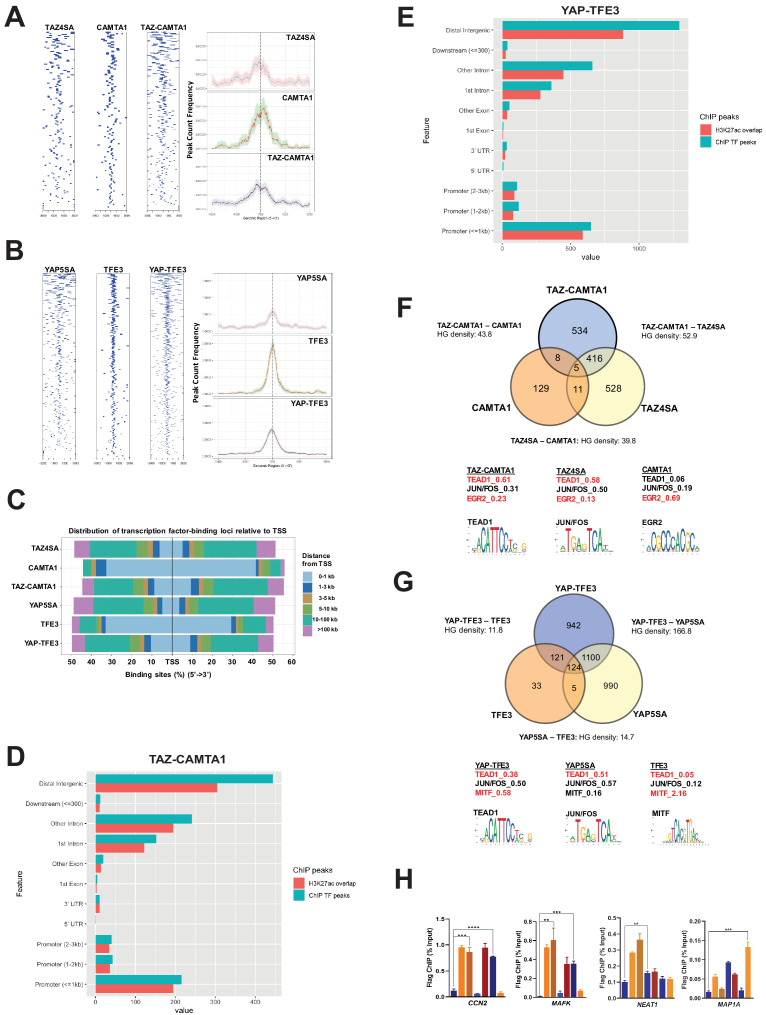
Figure 4—source data 1. ChIP AME Motif Enrichment Analysis.
Figure 4—source data 2. Differentially expressed genes also bound by fusion proteins and controls as determined by ChIP-Seq.
elife-62857-fig4-data2.xlsx (178.9KB, xlsx)

Figure 4.

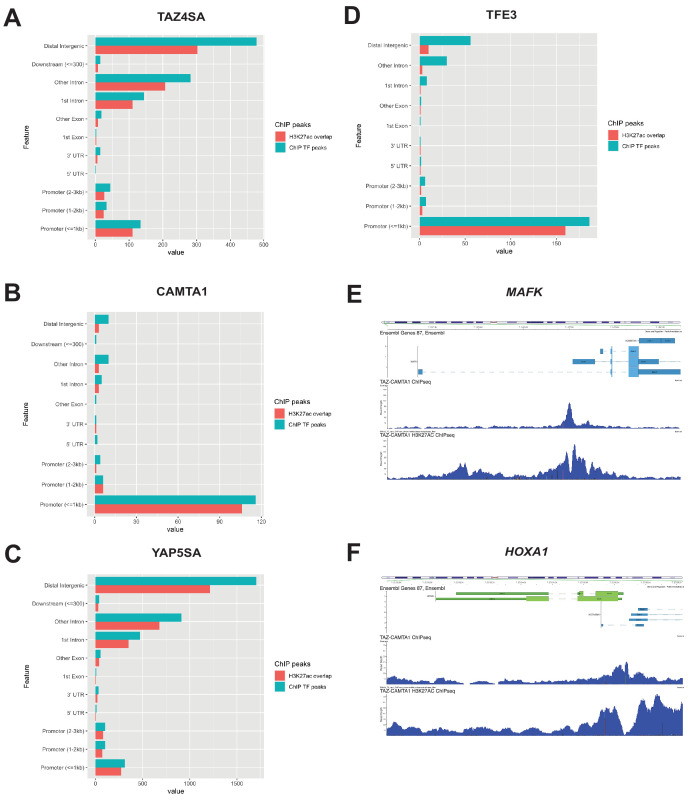
Figure 4—figure supplement 1. Distribution of overlapping transcription factor and H3K27ac ChIP peaks among annotated functional DNA-binding sites.

Figure 4—figure supplement 1.

Overlapping transcription factor/coactivator ChIP peaks shown for annotated functional DNA binding sites in SW872 cells expressing (A) TAZ4SA, (B) CAMTA1, (C) YAP5SA, and (D) TFE3. (E) Combined Flag-TAZ-CAMTA1 and H3K27ac ChIP-Seq tracks in SW872 cells expressing Flag-TAZ-CAMTA1 centered around the transcriptional start sites for (E) MAFK and (F) HOXA1. ChIP-Seq experiments immunoprecipitating Flag-TAZ4SA, Flag-CAMTA1, Flag-YAP5SA, and Flag-TFE3 were performed in biological triplicates. H3K27ac ChIP-Seq was performed in biological duplicates for each of the constructs. For ChIP-Seq analysis, the population was set as the total number of genes annotated across all conditions.
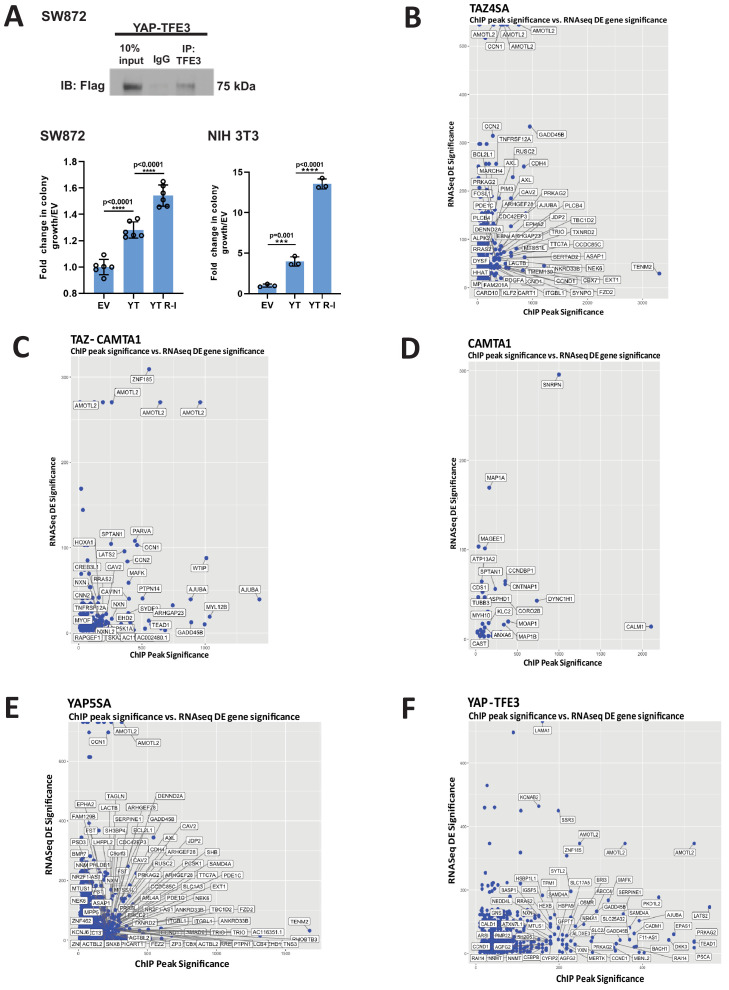
Figure 4—figure supplement 2. Characterization of YAP-TFE3 and TAZ-CAMTA1 DNA binding in SW872 cells.

Figure 4—figure supplement 2.

(A) Pull-down of TFE3 reveals interaction with Flag-YAP-TFE3 by co-immunoprecipitation, consistent with enrichment of the MiTF consensus DNA binding sequence and mass spectrometry data. Soft agar studies after disrupting the bHLH domain (YT R-I mutation) in the TFE3 component of YAP-TFE3. (B–F) Scatterplot arraying differentially expressed genes in terms of increasing statistical significance along the Y axis, and genes in terms of increasing ChIP peak ‘score’ (i.e. statistical significance) along the X axis. Many TAZ-CAMTA1 (C) and YAP-TFE3 (F) bound genes are also differentially expressed. TAZ4SA (B), CAMTA1 (D), and YAP5SA (E) controls included. Co-immunoprecipitation and soft agar assays repeated at least twice. RNA-Seq and ChIP-Seq experiments were performed in biological triplicates. For gene expression data, the population was set to the total number of recovered genes with the mean of five counts across all samples. For ChIP-seq, the population was set as the total number of genes annotated across all conditions.
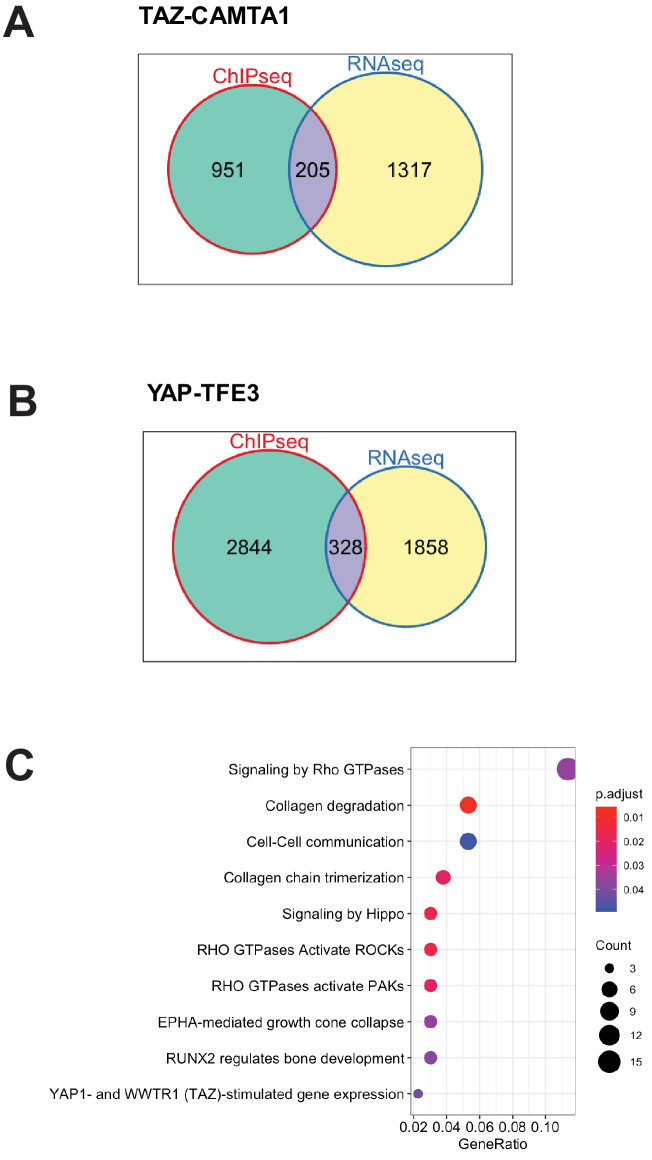
Figure 4—figure supplement 3. TAZ-CAMTA1 and YAP-TFE3-bound genes are differentially expressed.

Figure 4—figure supplement 3.

(A) Venn diagram showing intersection of DE expressed genes in SW872 TAZ-CAMTA1 with TAZ-CAMTA1-bound genes. (B) Venn diagram showing intersection of DE expressed genes in SW872 YAP-TFE3 with YAP-TFE3-bound genes. (C) KEGG pathway enrichment analysis of the collection of genes representing the intersection of TAZ-CAMTA1-bound genes (by ChIP-Seq) and DE genes in TAZ-CAMTA1 expressing SW872 cells. RNA-Seq and ChIP-Seq experiments were performed in biological triplicates. For gene expression data, the population was set to the total number of recovered genes with the mean of five counts across all samples. For ChIP-seq, the population was set as the total number of genes annotated across all conditions.