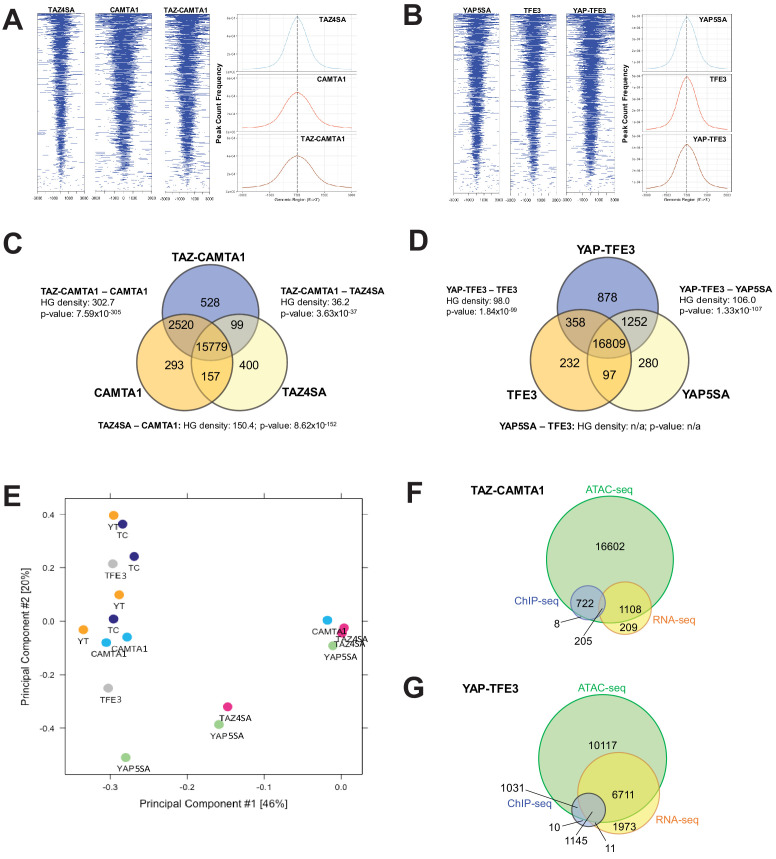
Figure 5. TAZ-CAMTA1 and YAP-TFE3 promote the formation of chromatin accessible to transcriptional regulation.
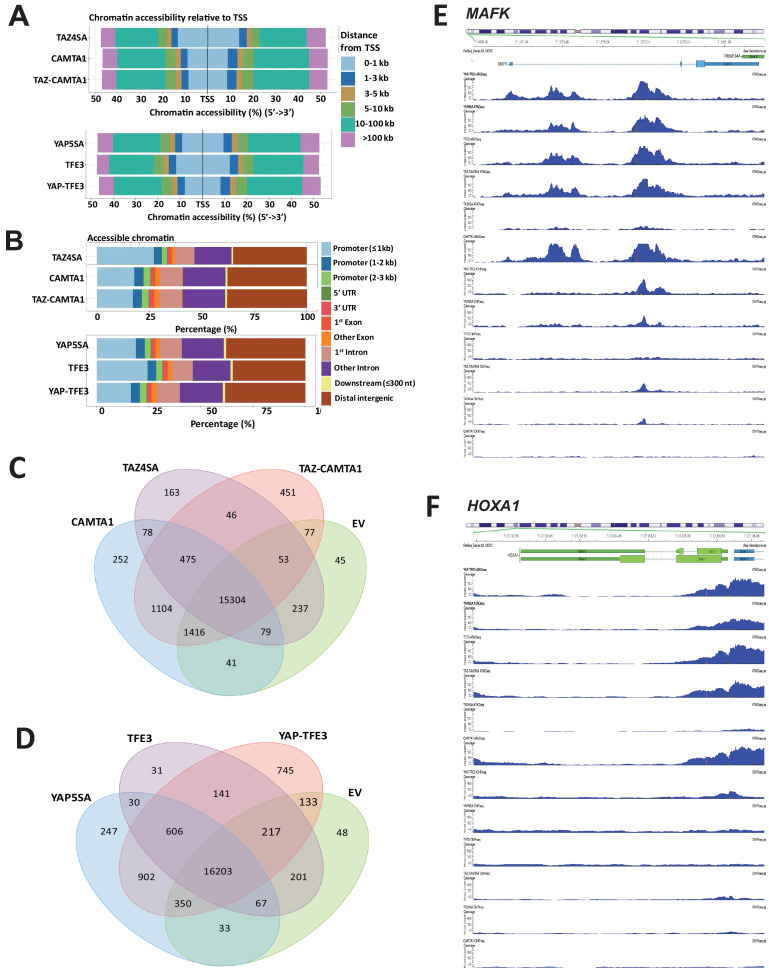
(A) Heat map of ATAC peak distribution around the transcriptional start site (TSS) region and average ATAC TSS profile for TAZ-CAMTA1 and controls and (B) for YAP-TFE3 and controls. (C) Intersection of gene annotations for transposase accessible chromatin peaks in TAZ-CAMTA1 and controls and (D) YAP-TFE3 and controls. HG density represents the –log10(hypergeometric density). p value for hypergeometric analysis included. (E) DiffBind principal component analysis for fusion proteins and controls. (F) Overlay of differentially expressed genes, bound genes, with transposase accessible chromatin for TAZ-CAMTA1. (G) Overlay of differentially expressed genes, bound genes, with transposase accessible chromatin for YAP-TFE3. ATAC-Seq experiments in SW872 cells were performed using biological triplicates for each of the conditions (expression constructs). For ATAC-Seq analysis, the population was set as the total number of genes annotated across all conditions. Hypergeometric testing was performed using the phyper() function in the stats R package (v3.6.3) set to assess enrichment and the lower tail set to false. Hypergeometric density was calculated using the related dhyper function and converted using the negative log10 of the output.


