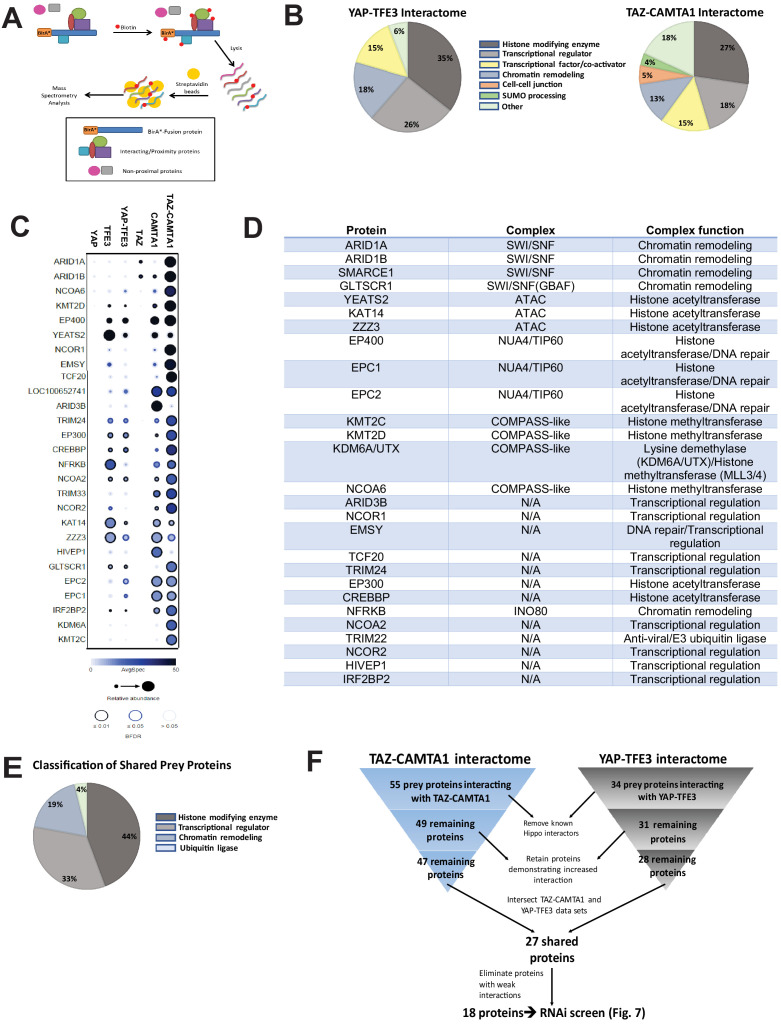
Figure 6. The TAZ-CAMTA1 and YAP-TFE3 interactomes are enriched for transcriptional regulators and chromatin modifiers.
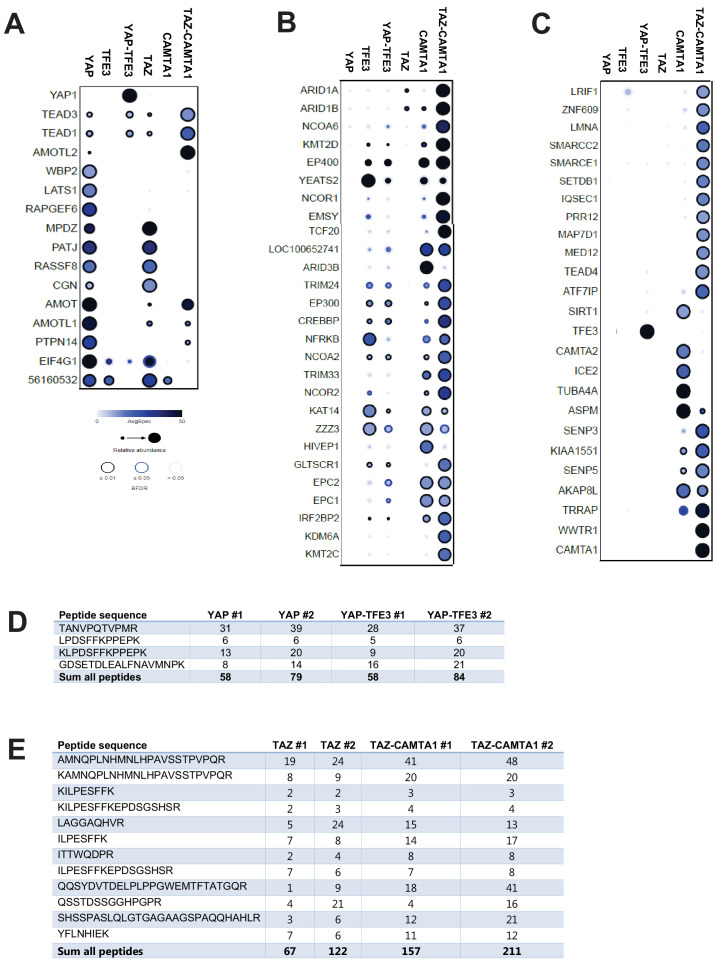
(A) Overview of BioID method. (B) Summary of YAP-TFE3 and TAZ-CAMTA1 interactomes. (C) Dot plot representation of chromatin modifiers shared by YAP-TFE3 and TAZ-CAMTA1 interactomes. (D) Table of chromatin modifiers shared by YAP-TFE3 and TAZ-CAMTA1 interactomes. (E) Classification of prey proteins shared between TAZ-CAMTA1 and YAP-TFE3 interactomes. (F) Algorithm to prioritize the TAZ-CAMTA1 and YAP-TFE3 interactomes for the subsequent RNAi screen. For BioID mass spectrometry, two biological replicates were made for each cell line. Affinity purification and proximity biotinylation coupled to mass spectrometry were performed as described in Lambert et al., 2015. SAINT (significance analysis of interactome) analysis (Choi et al., 2011) was performed on the mass spectrometry data, using 10 controls compressed to 5. Only proteins with iProphet protein probability ≥ 0.95 were used. Results are expressed in dotplot format. Each prey protein is represented as a dot, with color signifying average spectral count, the darkness indicating average spectral count between the two biological replicates (the darker the dot, the higher the average spectral count), and the size represents the relative abundance. Darkness of the ring indicates the Bayesian False Discovery Rate (BFDR); black (FDR ≤ 0.01), blue (FDR ≤ 0.05), light blue (FDR > 0.05). The data was filtered so that each prey had a minimum of 10 spectral counts in at least one of the biological replicates.


