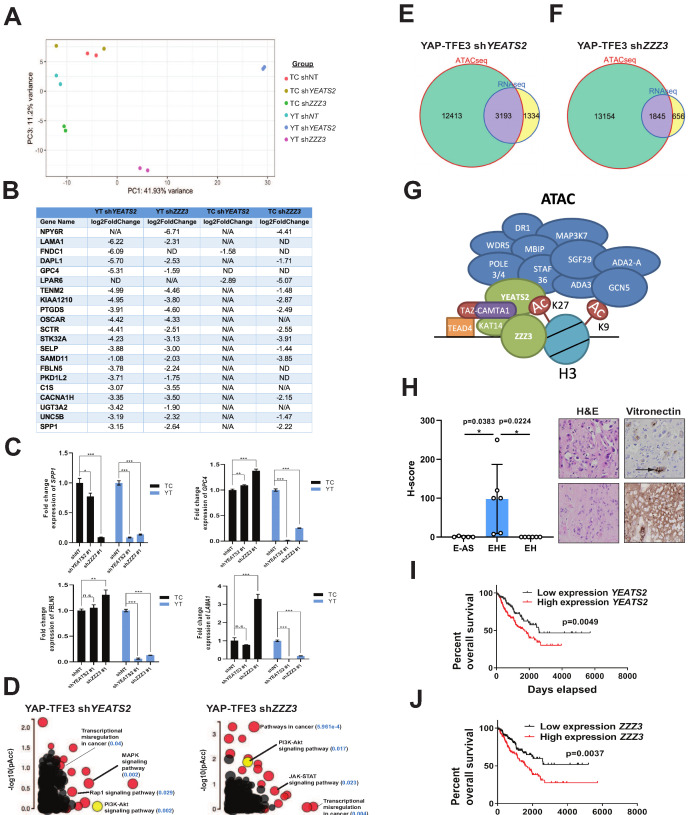
Figure 8. The ATAC complex is critical for the oncogenic transcriptomes of the fusion proteins.
(A) Principal component analysis showing the effect of knock-down of YEATS2 or ZZZ3 on the TAZ-CAMTA1 and YAP-TFE3 transcriptomes. (B) Genes with at least a two-fold decrease in at least two of the four conditions (YT shYEATS2, YT shZZZ3, TC shYEATS2, and TC shZZZ3); top genes most down-regulated according to aforementioned filter. N/A indicates gene was not differentially expressed in the data set. ND indicates there was no decrease in expression. (C) Extracellular matrix-related downregulated genes in part B validated by quantitative RT-PCR. (D) Scatter plot of two types of pathway enrichment evidence: probability of over-representation (pORA) and probability of accumulation (pAcc) as calculated by iPathwayGuide for SW872 YAP-TFE3 cells with knock-down of YEATS2 or ZZZ3. (E) Intersection of differentially expressed genes after knock-down of YEATS2 in SW872 YAP-TFE3 cells with open chromatin regions unique to YAP-TFE3 expressing cells (not present with empty vector). (F) Intersection of differentially expressed genes after knock-down of ZZZ3 in SW872 YAP-TFE3 cells with open chromatin regions unique to YAP-TFE3 expressing cells (not present with empty vector). (G) Working model of TAZ-CAMTA1:ATAC complex. (H) Vitronectin expression in epithelioid hemangioendothelioma (EHE) compared to epithelioid angiosarcoma (E–AS) and epithelioid hemangioma (EH). Vitronectin expression could be more focal (top example of EHE) and secreted in the ECM between neoplastic cells (demonstrated by arrow) or more diffusely expressed in the ECM (bottom example of EHE). Overall survival curves as a function of YEATS2 (I) and ZZZ3 RNA expression (J) across different histological types of sarcoma utilizing RNA-Seq expression data for The Cancer Genome Atlas (TCGA). RNA-Seq experiments in SW872 cells were performed using biological duplicates for each of the conditions. For gene expression data, the population was set to the total number of recovered genes with the mean of five counts across all samples. ATAC-Seq experiments in SW872 cells were performed using biological triplicates for each of the conditions (expression constructs). For ATAC-Seq analysis, the population was set as the total number of genes annotated across all conditions. For quantitative RT-PCR, standard deviation was calculated from fold change values for each triplicate. Error bars were used to define one standard deviation. For Kaplan-Meier curves significance was determined by Log-rank (Mantel-Cox) test. Each experiment was repeated at least twice. For all panels, ****p<0.0001, ***p<0.001, **p<0.01, *p<0.05.


