. 2021 May 6;10:e64150. doi: 10.7554/eLife.64150

Figure 3. Microsaccade metrics were altered when the movements coincided with SC visual bursts, and the alteration was related to SC visual burst strength.

(A) Time course of microsaccade amplitude in the contrast task (experiment 1) relative to stimulus onset (for neurons with eccentricities ≤ 4.5 deg). The data were subdivided according to stimulus contrast (three different colors representing the three highest contrasts in our task). Movement amplitudes were small (microsaccades) in the baseline pre-stimulus interval, but they sharply increased after stimulus onset, reaching a peak at around 70–80 ms. Moreover, the metric alteration clearly depended on stimulus contrast. N = 288, 206, and 222 microsaccades for the highest, second highest, and lowest contrast, respectively. (B) Normalized firing rates relative to stimulus onset for the extra-foveal neurons (≤4.5 deg preferred eccentricity) that we recorded simultaneously in experiment one with the eye movement data in A. The alterations in movement metrics in A were strongly related, in both time and amplitude, with the properties of the SC visual bursts. Figure 3—figure supplement 1 shows the results obtained from more eccentric neurons and stimuli (>4.5 deg), and Figure 3—figure supplement 2 shows similar observations from the spatial frequency task (experiment 2). A subsequent figure (Figure 4—figure supplement 3) described the full dependence on eccentricity in our data. Error bars denote 95% confidence intervals.
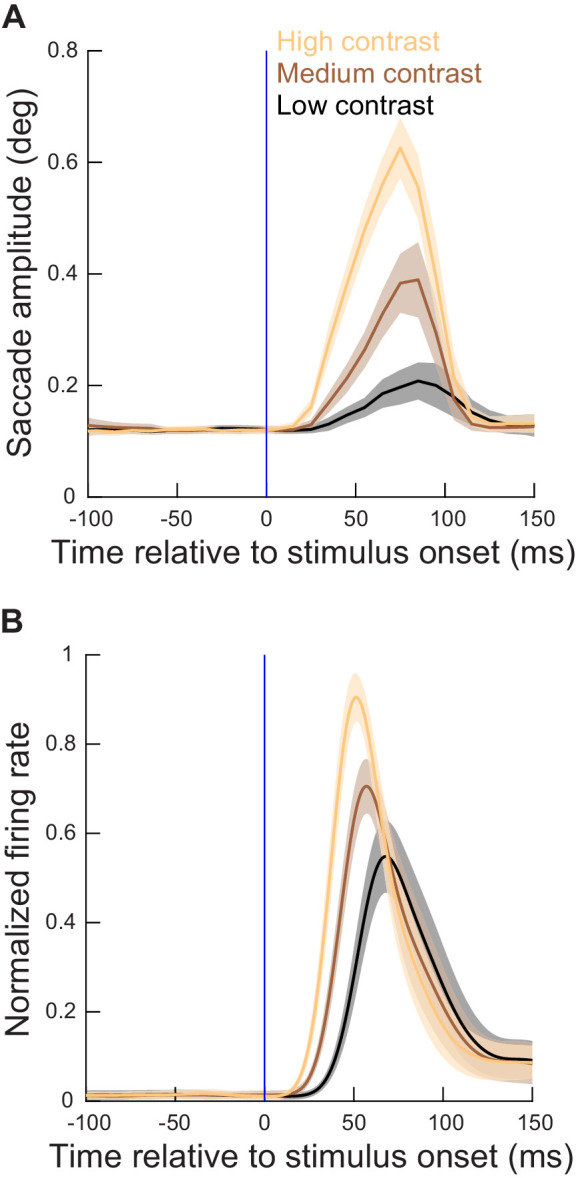
Figure 3—source data 1. Excel table with the source data for this figure.

Figure 3.

Figure 3—figure supplement 1. More eccentric stimuli relative to the generated movement amplitudes had weaker effects on metric alterations than the less eccentric stimuli of Figure 3.
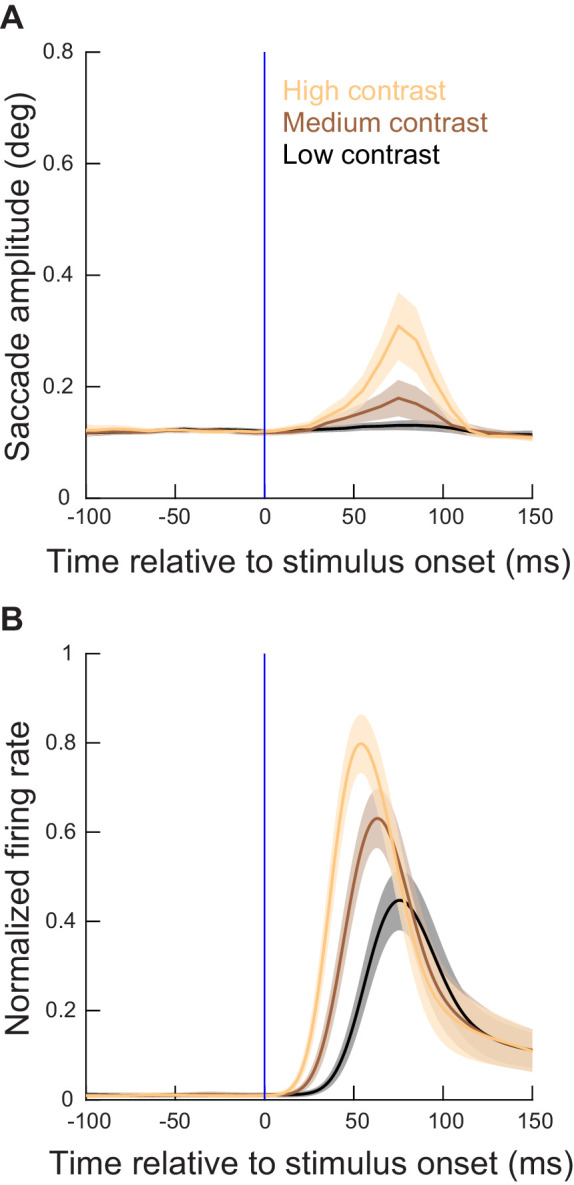
Figure 3—figure supplement 1.

(A) Time courses of microsaccade amplitudes relative to stimulus onset (from experiment 1) when the visual stimuli were presented at eccentricities > 4.5 deg (and <20 deg; Figure 1). N = 263, 289, and 458 microsaccades for the highest, second highest, and lowest contrast, respectively. The figure is otherwise formatted identically to Figure 3. As can be seen, there were weaker effects of more eccentric stimuli on microsaccades, even though the stimuli were made bigger to fill the RF’s (Materials and methods), and also even though the raw visual bursts showed similar properties to the more central neurons’ visual bursts (B and Figure 3—figure supplement 3). Also see Figure 4—figure supplement 3. (B) From the same experiment (contrast task), normalized firing rates of the more eccentric neurons relative to stimulus onset. The raw firing rates are shown in Figure 3—figure supplement 3, and, together with the current figure, they demonstrate that there was a weaker impact of more eccentric spiking activity on microsaccades; that is, the more eccentric bursts were similar in strength to the more central bursts, but they still had a smaller impact on microsaccade amplitudes in A. Note that, consistent with Hafed and Ignashchenkova, 2013; Buonocore et al., 2017; Malevich et al., 2020b, microsaccade amplitudes at the time of SC visual bursts were decreased relative to baseline (by a small amount) for movements that were opposite the stimulus locations (see Figure 6). This suggests that visual bursts opposite a planned movement might hamper the movement’s execution (Buonocore et al., 2017).
Figure 3—figure supplement 1—source data 1. Excel table with the source data for this figure.
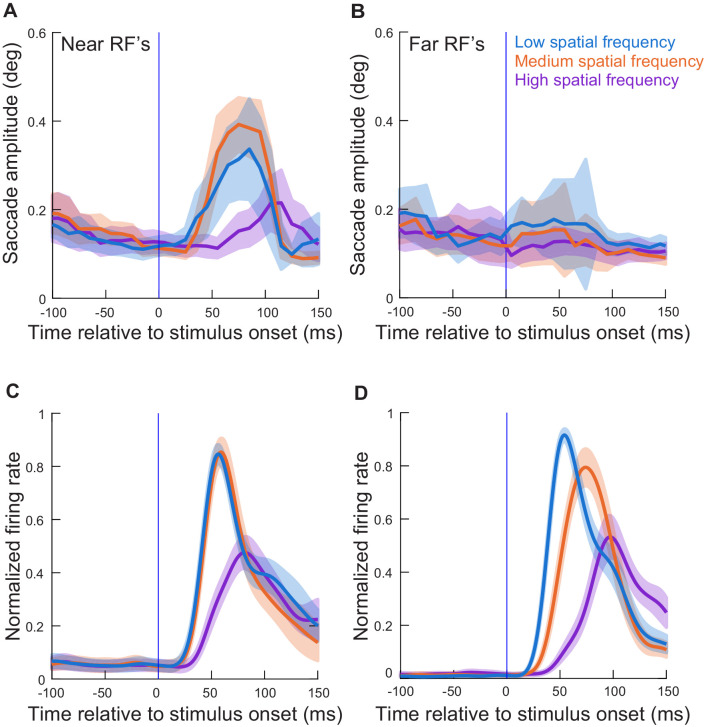
Figure 3—figure supplement 2. Results similar to those in Figure 3 and Figure 3—figure supplement 1 but with the spatial frequency task (experiment 2).

Figure 3—figure supplement 2.

(A, C) Similar analyses to those in Figure 3A,B, but for the neurons recorded during the spatial frequency task (experiment 2). As in Figure 3A,B, the neurons here had preferred eccentricities ≤ 4.5 deg. (B, D) Similar analyses to A, C, but now for the neurons with preferred eccentricities > 4.5 deg. The impacts on microsaccade amplitudes were now much weaker, consistent with Figure 3—figure supplement 1. All other conventions are similar to Figure 3 and Figure 3—figure supplement 1. Note that in A, C, the amplitude effects were smaller than those in Figure 3, likely because the different stimulus types and sizes activated different numbers of overall neurons simultaneously (Figure 6 and Figure 6—figure supplement 1 show that per-neuron spike times relative to amplitude effects were highly similar across the two tasks).
Figure 3—figure supplement 2—source data 1. Excel table with the source data for this figure.
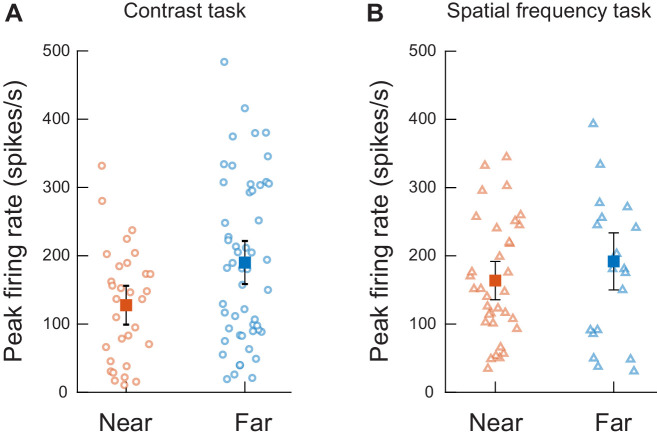
Figure 3—figure supplement 3. Despite smaller effects on microsaccade amplitudes (Figure 3—figure supplements 1 and 2), more eccentric visual bursts were not weaker than more central ones.

Figure 3—figure supplement 3.

(A) Peak firing rate measurements from experiment one for neurons with an RF location ≤4.5 deg (Near, orange) or >4.5 deg (Far, blue) from fixation. Each dot represents one neuron. Solid squares represent the averages for each group. Error bars represents two standard errors of the mean. In this example (for clarity of the figure), the visual stimuli presented to the neurons were gratings with the second highest contrast only. N = 31 and 53 neurons, respectively, for the more central and more eccentric neurons (t(83) = −2.648 p=0.01). (B) Similar analyses and results, shown here only for the lowest spatial frequency (for clarity) from experiment 2. N = 34 and 21 neurons, respectively, for the more central and more eccentric neurons (t(53) = 1.20 p=0.23).
Figure 3—figure supplement 3—source data 1. Excel table with the source data for this figure.