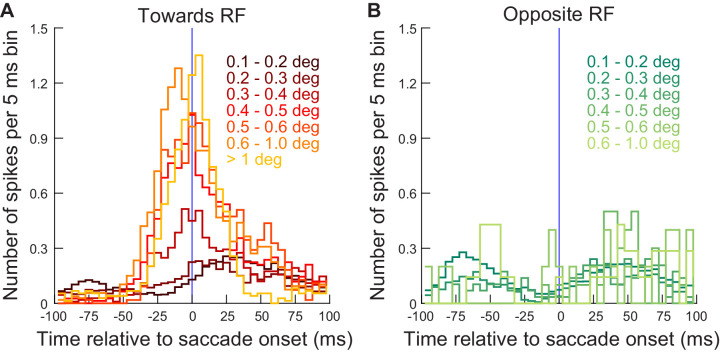
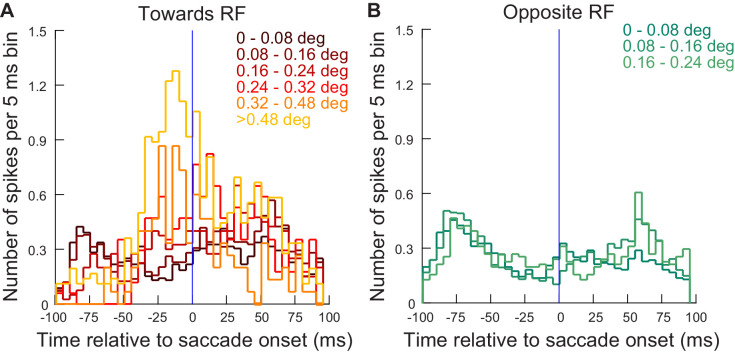
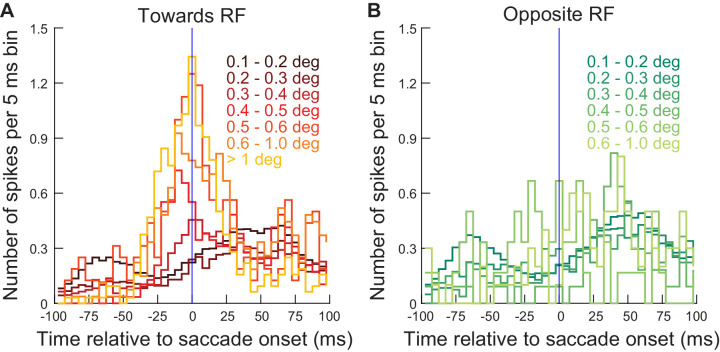
Figure 6. Exogenous, movement-unrelated ‘visual’ spikes affected movement metrics when they occurred within approximately ±30 ms from movement onset.
(A) For the different microsaccade amplitude ranges from Figure 5 (color-coded curves), we counted the number of exogenous spikes occurring from a recorded extra-foveal SC neuron (≤4.5 deg) within any given 5 ms time bin around movement onset (range of times tested: −100 ms to +100 ms from movement onset). The lowest two microsaccade amplitude ranges (0.1–0.2 and 0.2–0.3 deg) reflected baseline amplitudes during steady-state fixation (e.g. Figure 3), and they were not correlated with additional extra-foveal spiking activity around their onset (two darkest red curves). For all other larger microsaccades, they were clearly associated with precise timing of extra-foveal ‘visual’ spikes occurring within approximately ±30 ms from movement onset, regardless of movement size. The data shown are from experiment 1; similar observations were made from experiment 2 (Figure 6—figure supplement 1). The number of movements contributing to this figure is the same as in Figure 5. (B) Same as A but for movements opposite the recorded neuron’s RF locations. There were fewer spikes during the peri-saccadic interval, suggesting that it was easier to trigger eye movements when there was no activity present in the opposite SC. Figure 6—figure supplement 2 shows similar results from the far neurons (>4.5 deg eccentricity) of the same experiment (experiment 1).


