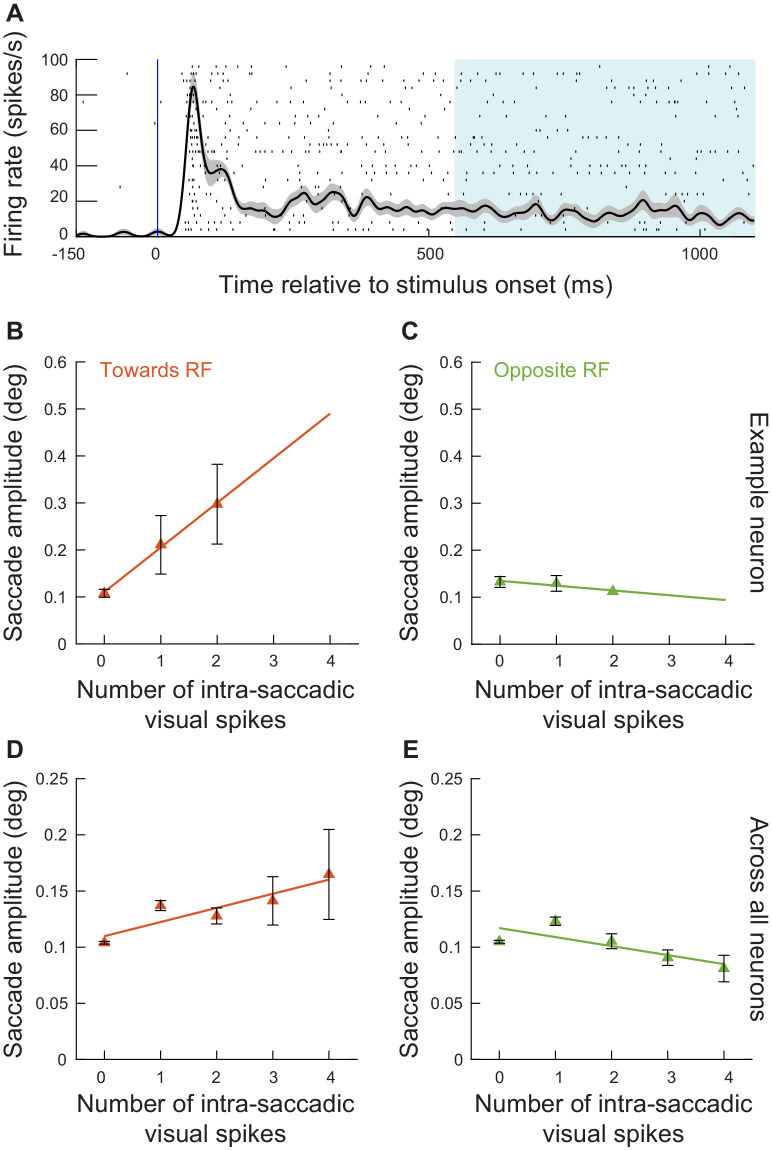
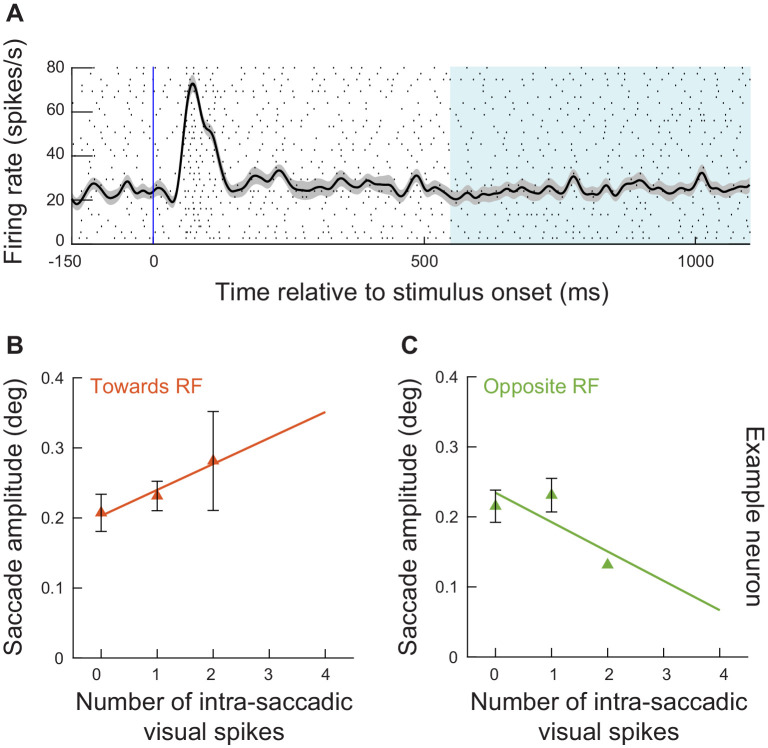
Figure 7. Exogenous, movement-unrelated spikes influenced eye movement metrics even when they did not occur within stimulus-driven ‘visual’ bursts.
(A) In experiment 2, we had a prolonged period of fixation after stimulus onset. This meant that there was low-level discharge present in the SC long after the end of the initial ‘visual’ burst, as shown in this example neuron (spike raster and average firing rate across trials with the preferred spatial frequency in the RF; error bars denote s.e.m.). This allowed us to select all microsaccades occurring >550 ms after stimulus onset, and to ask whether movement-unrelated SC spiking activity that was coincident with these movements still influenced their metrics. (B) For the example neuron in A and for microsaccades > 550 ms after stimulus onset and towards the RF, we performed an analysis like that of Figure 4B. There was a positive correlation between the number of intra-saccadic spikes and movement amplitude. Note that we combined trials with the lowest two spatial frequencies to increase the numbers of observations in this analysis. The numbers of movements contributing to each x-axis point are 62, 10, and 4 microsaccades for 0, 1, and 2 spikes, respectively. (C) Same as B but for movements opposite the RF from the same session. The numbers of movements contributing to each x-axis point are 77, 20, and 1 microsaccades for 0, 1, and 2 spikes, respectively. (D) Relationship between the number of intra-saccadic SC ‘sustained’ spikes (i.e. not part of ‘visual’ bursts) and microsaccade amplitudes for eye movements triggered >550 ms after grating onset from all sessions of experiment 2. We included trials from all spatial frequencies. For each microsaccade towards the RF location, we counted how many ‘sustained’ spikes were emitted by a given recorded neuron in the interval 0–20 ms after microsaccade onset. We then plotted microsaccade amplitude as a function of intra-saccadic ‘sustained’ spikes. Even when the spikes occurred outside of ‘visual’ bursts, they still had an influence on movement metrics. The numbers of movements contributing to each x-axis point are 4009, 747, 226, 62, and 26 microsaccades for 0, 1, 2, 3, and 4 spikes, respectively. (E) Same as D but for movements opposite the RF location. There was no increase in microsaccade amplitude. The numbers of movements contributing to each x-axis point are 4114, 721, 157, 45, and 16 microsaccades for 0, 1, 2, 3, and 4 spikes, respectively. Error bars in B–D denote 95% confidence intervals.


