. 2021 May 24;10:e63708. doi: 10.7554/eLife.63708

Figure 1. Dopaminergic fibers from VTA/SNC targeting dm- and vm-ITC clusters in the amygdala co-label with vGAT and vGluT1/2.

(A–B) Maximum intensity projection confocal images illustrating ChR2-YFP+ axons (green) originating from tyrosine hydroxylase (TH)-positive dopaminergic neurons (TH, red) in the ventral tegmental area/substantia nigra pars compacta (VTA/SNC) targeting FoxP2-positive neurons (magenta) in the dorsomedial (dm)- and ventromedial (vm)-intercalated cell (ITC) clusters. Overlay (left), TH staining (middle), ChR2-YFP (right). Scale bars: 10 µm. (C) Representative image volumes of the dm- and vm-ITC clusters with FoxP2-labeled nuclei (magenta) and ChR2-YFP+ axons (green). Scale bar: 10 µm. (D) The volume fraction encompassed by ChR2-YFP+ axons was significantly higher in the dm-ITC (6.40 ± 0.94% of total image volume) compared to the vm-ITC cluster (2.72 ± 0.30% of total image volume; unpaired t-test, **p=0.0097). Histograms display the mean ± SEM and values from individual mice (empty circles, n=4 animals). The average dm- and vm-ITC cluster volume analyzed per animal was 138.15 ± 29.51 and 156.12 ± 10.29 µm3, respectively. (E–F) Overlay confocal images of ChR2-YFP+ axons (green) and biocytin-filled cells (turquoise) in dm-ITC and vm-ITC clusters immunostained for the presynaptic marker Bassoon to examine putative active zones (white arrows). Scale bars 5 and 1 µm (inset). (G–H) Confocal images of dm- and vm-ITC clusters, including FoxP2-positive neurons (turquoise) that contain ChR2-YFP+ fibers (green) co-labeled for the presynaptic markers vGluT1/vGluT2 (magenta). Right panels show a higher magnification of the boxed area containing an example of a bouton co-expressing ChR2-YFP and vGluT1/vGluT2 outlined in white. (I–J) Confocal images of dm- and vm-ITC clusters, including FoxP2-positive neurons (turquoise) that contain ChR2-YFP fibers (green) co-labeled for the presynaptic marker vGAT (magenta). Right panels show a higher magnification of the boxed area containing an example of a bouton co-expressing ChR2-YFP and vGAT outlined in white. Scale bars for (G–J): 10 µm for left panels, 3 µm for right panels. Thickness of confocal z-stacks: (A) 11.1 μM; (B) 12.5 μM; (E) 8.06 and 2.01 µm for the cell and synapse on dendrite, respectively; (F) 12.2 and 2.2 µm for the cell and synapse on dendrite, respectively; (G–J) left panels, 8.83 µm; right panels, single plane of 0.18 µm nominal thickness.

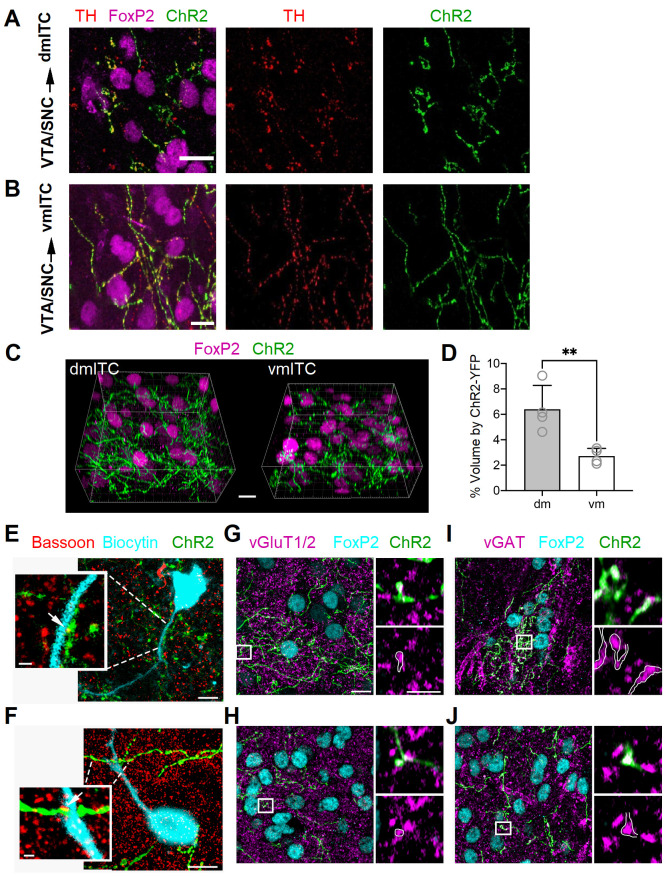
Figure 1—source data 1. Data Figure 1D.

Figure 1.

Figure 1—figure supplement 1. Specific expression of ChR2-YFP in dopaminergic midbrain neurons.

Figure 1—figure supplement 1.

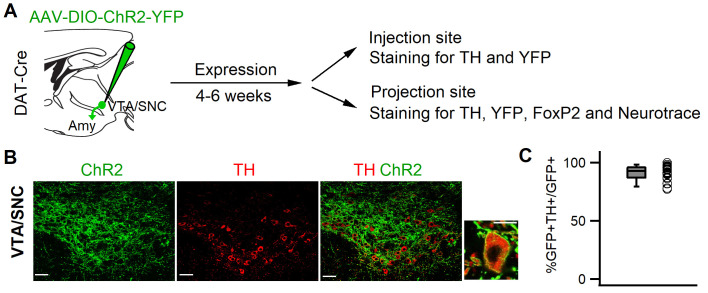
(A) Experimental strategy: Targeting of dopaminergic midbrain neurons by injecting DAT-Cre mice with AAV-DIO-ChR2-YFP. Subsequent examination of injection and projection sites using tyrosine hydroxylase (TH) and FoxP2 immunostaining, as well as Neurotrace (NT), to delineate brain structures. (B) Single-plane confocal images (0.9 µm thickness) of ventral tegmental area/substantia nigra pars compacta (VTA/SNC) midbrain neurons expressing ChR2-YFP (green, left) immunolabeled for TH (red, middle), and overlay (right), including close-up of a TH-positive ChR2-YFP-expressing cell. Scale bars 100 µm (overview), 10 µm (close-up). (C) On average, 91.17 ± 1.37% of ChR2-YFP-expressing midbrain neurons were TH-positive (n=10 hemispheres from five animals).
Figure 1—figure supplement 1—source data 1. Data Figure 1—figure supplement 1C.
Figure 1—figure supplement 2. Labeling of TH-positive axons in the amygdala.

Figure 1—figure supplement 2.

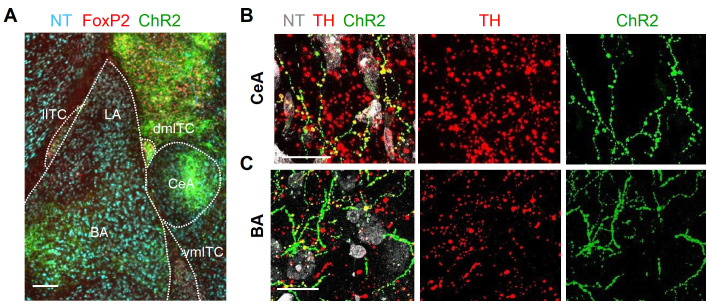
(A) Fluorescence microscopic overview image of the amygdala showing ChR2-YFP+ axons distributed in central amygdala (CeA), basal amygdala (BA), intercalated cell (ITC) clusters, and the amygdala-striatal transition zone. Scale bar 200 µm. (B–C) Maximum intensity projection confocal images of ChR2-YFP+ axons (green, right panel), punctate labeling with tyrosine hydroxylase (TH) (red) in the same area (middle panel), and overlay together with Neurotrace (NT) (grey, left panel), demonstrating that ChR2-YFP+ axons are decorated with TH-positive puncta (yellow) in CeA (B) and basolateral complex of the amygdala (BLA) (C). Thickness of confocal z-stacks: 12.9 and 11.7 µm for (B) and (C), respectively. Scale bars 10 µm.
Figure 1—figure supplement 3. Example of 3D analysis of axonal volumes in ITC clusters.

Figure 1—figure supplement 3.

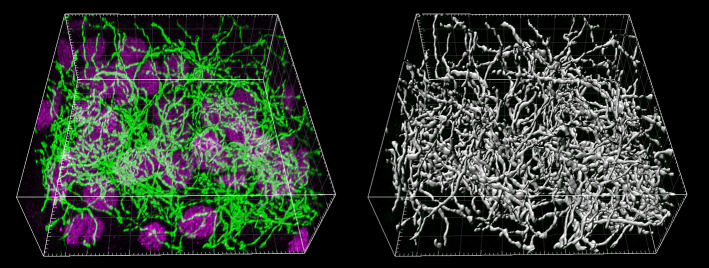
Left: Image volume showing FoxP2-labeled nuclei (magenta) of neurons in the dorsomedial-intercalated cell (dm-ITC) cluster and midbrain dopaminergic axons expressing ChR2-YFP (green). Right: Surface rendering of ChR2-YFP+ axons. Images are derived from processing of volumes with IMARIS 9.7.0 software.
Figure 1—figure supplement 4. Quantitative analysis TH-staining reveals stronger labeling in dm- versus vm-ITC clusters.

Figure 1—figure supplement 4.

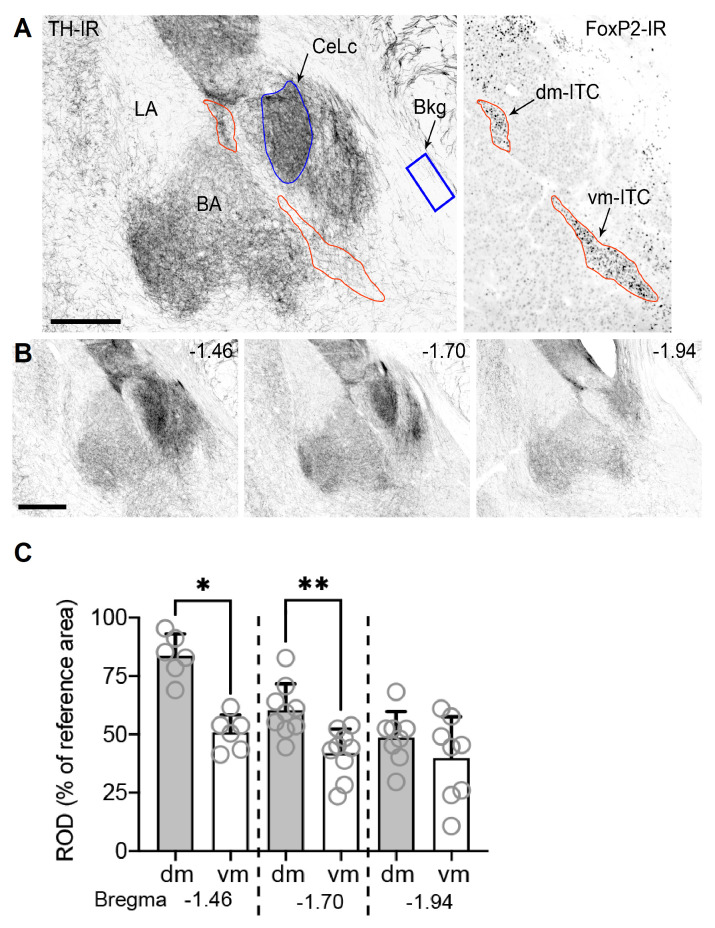
(A) Representative images of tyrosine hydroxylase (TH) and FoxP2 immunoreactivity (IR) from consecutive amygdala sections of C57BL/6J adult male mice. FoxP2-IR, associated primarily with nuclei of intercalated cells (ITCs), was used to delineate the dorsomedial (dm)- and ventromedial (vm)-ITC clusters (outlined in red). The central component of the central lateral nucleus (CeLc) of the amygdala (outlined in blue) was used as a reference area for its very high density of TH-IR fibers. An area within the optic nerve (blue box) was used to calculate the background mean grey value (MGV). Scale bar 250 µm. (B) Representative images of three different amygdala rostro-caudal levels (bregma −1.46,–1.70, and −1.94) at which the TH-IR MGV within the dm- and vm-ITC clusters was analyzed. Scale bar 500 µm. (C) Significant changes in the TH-IR relative optical density (ROD) between dm- and vm-ITC clusters were observed at bregma −1.46 (Wilcoxon test, *p=0.031) and −1.70 (Wilcoxon test, **p=0.004), but not at −1.94 (Wilcoxon test, p=0.195). Higher TH-IR ROD was detected at different bregma levels in the dm-ITC clusters (one-way ANOVA, F(2,20)=18; p<0.0001), at bregma −1.46 vs. −1.70 (Tukey’s multiple comparison post-hoc test, p=0.0015) and −1.46 vs. −1.94 (Tukey’s multiple comparison post-hoc test, p<0.0001). Conversely, no differences were observed in the TH ROD at different bregma levels in the vm-ITC cluster (one-way ANOVA, F(2,20)=1.3; p=0.28). Histograms display the mean ± SEM and values from individual mice (empty circles, n=9 animals, not all bregma levels represented in all animals).
Figure 1—figure supplement 4—source data 1. Data Figure 1—figure supplement 4C.
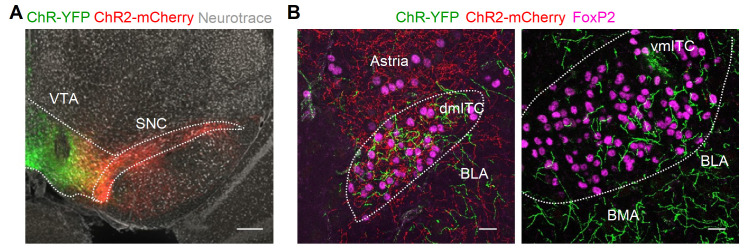
Figure 1—figure supplement 5. Dm-ITC and vm-ITC clusters receive differential inputs from VTA and SNC.

Figure 1—figure supplement 5.

(A) Fluorescence microscopic overview image of the dopaminergic midbrain showing neurons transduced with ChR2-YFP (green) and ChR2-mCherry (red) in ventral tegmental area (VTA) and substantia nigra pars compacta (SNC), respectively. Neurotrace is shown in grey. Scale bar 200 µm. (B) Resulting projection patterns in intercalated cell (ITC) clusters upon viral injections shown in (A). Maximum intensity projection confocal images of ChR2-YFP+ (green) and ChR2-mCherry+ (red) axons within FoxP2-positive dorsomedial (dm)-ITC (left) and ventromedial (vm)-ITC clusters (right). Thickness of confocal z-stacks: 20 µm. Scale bar 20 µm. Representative data from n=2 animals.