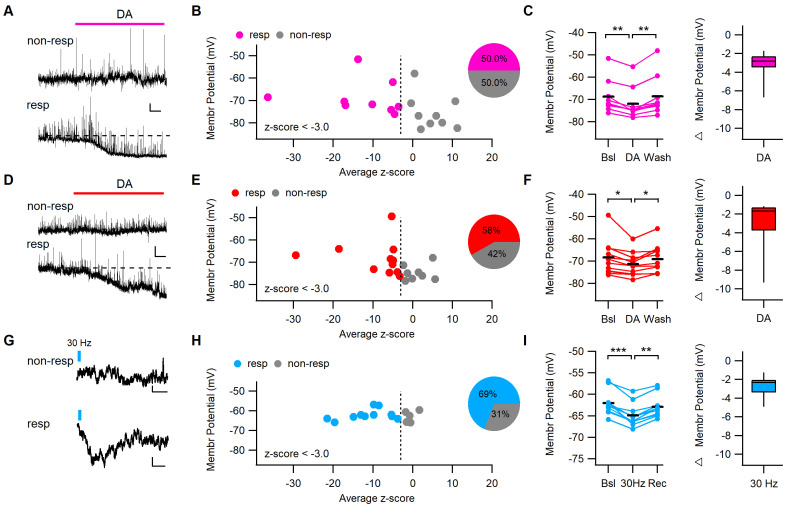
Figure 3. DA application or phasic stimulation of midbrain inputs hyperpolarizes a fraction of dm-ITCs.
(A, D) Representative traces of dorsomedial-intercalated cells (dm-ITCs) recorded at resting membrane potential in current clamp mode from young (postnatal day 20–28) and adult (8–10 weeks) mice. Dopamine (DA, 15–30 µM) was applied during the time indicated. Scale bars for (A): 3 mV, 30 s; and for D: 2 mV, 30 s. DA hyperpolarized some cells (responding), but not others (non-responding). (B, E) Distribution of recorded cells according to how DA affects their membrane potential represented as z-scores (x-axis) and their initial membrane potential (y-axis). Responding cells (z-score cut-off at −3) are shown in pink (young) or red (adult), non-responding cells in grey. Insets: fraction of DA-responsive neurons in young mice (n=18 cells from seven animals) and adult mice (n=19 cells from 10 animals). (C, F) Left: Absolute and relative changes in membrane potential in DA-responsive neurons recorded from young (C) and adult mice (F). DA significantly hyperpolarized responsive dm-ITCs in slices from young (n=9 cells from five animals, repeated-measures ANOVA: F(2, 16)=16.23, p<0.001; Bonferroni post-hoc test: Bsl vs. DA **p=0.001, DA vs. Wash **p=0.004) and adult animals (n=11 cells from eight animals, repeated-measures ANOVA: F(2, 20)=7.91, p=0.003; Bonferroni post-hoc test: Bsl vs. DA *p=0.016, DA vs. Wash *p=0.019). DA-induced hyperpolarization amounted to –3.18 ± 0.48 mV and –2.94 ± 0.83 mV in neurons from young and adult mice, respectively. (G) Representative traces of dm-ITCs recorded in current clamp mode from adult mice. Trains of 10 pulses at 30 Hz optogenetic stimulation of DA midbrain afferents were applied during the time indicated. Scale bars: 0.5 mV, 1 s. (H) Distribution of recorded cells according to 30 Hz stimulation of DA afferents affects their membrane potential represented as z-scores (x-axis) and their initial membrane potential (y-axis). Responding cells (z-score cut-off at −3) are shown in blue, non-responding cells in grey. Insets: Fraction of stimulation-responsive neurons (n=16 cells from three animals). (I) Absolute and relative changes in membrane potential in responsive neurons. 30 Hz stimulation significantly hyperpolarized responsive dm-ITCs (n=11 cells from two animals, repeated-measures ANOVA: F(2, 20)=49.01, p<0.001; Bonferroni post-hoc test: Bsl vs. Stim *p<0.001, Stim vs. Recovery *p=0.001). 30 Hz stimulation-induced hyperpolarization amounted to –2.84 ± 0.35 mV.
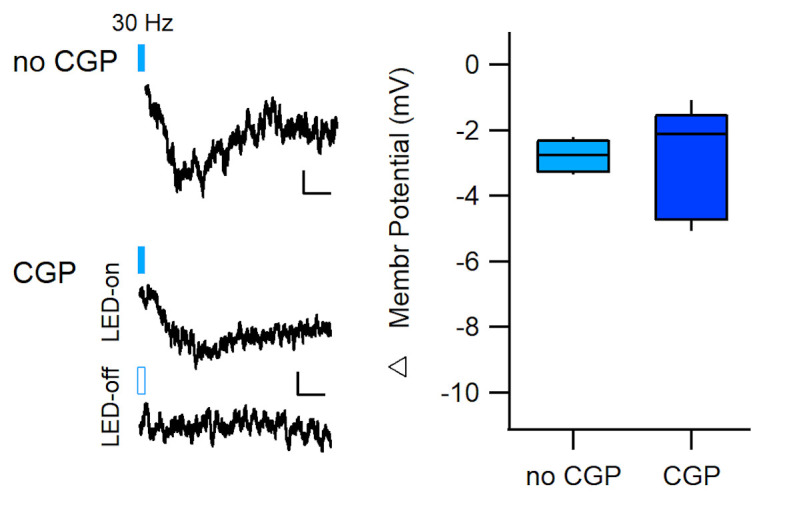
Figure 3—figure supplement 1. 30 Hz stimulation hyperpolarizes dm-ITCs in the presence of a GABAB receptor blocker.


