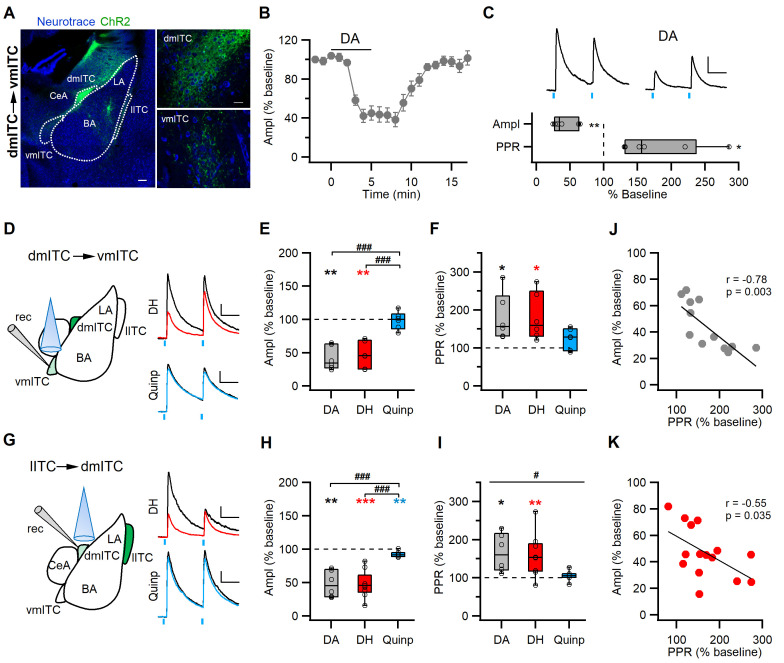
Figure 5. DA via DRD1 mediates presynaptic depression between ITC clusters.
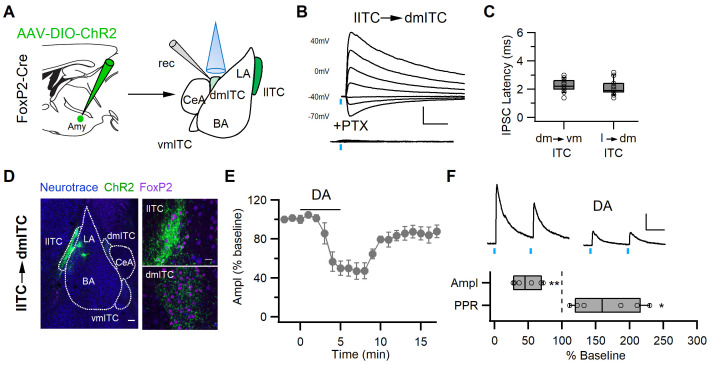
(A) Confocal images of the amygdala showing ChR2-YFP-expressing neurons in the dorsomedial-intercalated cell (dm-ITC) cluster and their efferents targeting the ventromedial-intercalated cell (vm-ITC) cluster after injection of AAV-DIO-ChR2-YFP in FoxP2-Cre mice. Left: Overview of the amygdala. Right: Details of the dm-ITC injection site with YFP+ cells (top) and vm-ITC recording site with YFP+ fibers (bottom). Scale bars: 200 and 20 µm. (B) Time course of changes in inhibitory postsynaptic current (IPSC) amplitude upon bath application of dopamine (DA, 30 µM, 5 min) in the dm-ITC→vm-ITC pathway. DA decreased IPSC amplitude, which returned to near baseline levels upon washout. (C) Top: Representative IPSC traces recorded at 0 mV from the baseline period and during DA application (paired pulse interval 100 ms). Scale bars: 50 pA, 50 ms. Bottom: Relative change of IPSC amplitude and paired pulse ratio (PPR) during DA application (n=6 cells from three animals, amplitude 41.53 ± 7.25%, paired t-test, **p=0.003; PPR 180.00 ± 25.01%, paired t-test, *p=0.031). (D and G) Left: Schematics of experimental approach with infection, recording, and light stimulation sites. Right: Representative traces recorded at baseline (black) and during agonist application (colored). Dihydrexidine (DH, 10 µM), a DRD1 agonist, is shown in red, Quinpirole (Quinp, 1 µM), a DRD2 agonist, is shown in blue (paired pulse interval: 100 ms). Scale bars 50 pA, 50 ms. (E and H) Comparison of relative changes in IPSC amplitude during agonist application in the dm-ITC→vm-ITC pathway (E) and l-ITC→dm-ITC pathway (H). (E) DH (red, n=6 cells from four animals) suppressed IPSCs (amplitude 46.69 ± 8.14%, **p=0.010, paired t-test), whereas Quinp (blue, n=6 cells from three animals) had no effect (amplitude 98.45 ± 5.37, p=0.438, paired t-test). Between-group analysis revealed a significant drug effect on the dm-ITC→vm-ITC amplitude (one-way ANOVA, F(2, 15)=20.107, p<0.001) with Quinp differing from DA and DH (###p<0.001 each, Bonferroni post-hoc tests). (H) DH (red, n=9 cells from five animals) strongly suppressed IPSCs (amplitude 47.16 ± 6.67%, ***p<0.001, paired t-test), whereas Quinp (blue, n=7 cells from three animals) had a minor effect (amplitude 92.38 ± 1.63%, **p=0.006). Between-group analysis revealed a significant drug effect on the l-ITC→dm-ITC amplitude (one-way ANOVA, F(2, 19)=17.394, p<0.001) with Quinp differing from DA and DH (###p<0.001 each, Bonferroni post-hoc tests). (F and I) Comparison of relative change of PPR during drug application in the dm-ITC→vm-ITC pathway and l-ITC→dm-ITC pathway. (F) DH (red, n=6) increased PPR (181.37 ± 25.38%, *p=0.035, paired t-test), whereas Quinp (blue, n=6) had no significant effect on PPR (123.97 ± 11.25%, p=0.127, paired t-test). Between-group analysis revealed no significant drug effect on the dm-ITC→vm-ITC PPR (one-way ANOVA, F(2, 15)=2.304, p=0.134). (I) DH (red, n=9) increased PPR (158.46 ± 18.52%, **p=0.005, paired t-test), whereas Quinp (blue, n=7) had no effect on PPR (105.02 ± 4.98%, p=0.385, paired t-test). Between-group analysis revealed a significant drug effect on the l-ITC→dm-ITC PPR (one-way ANOVA, F(2, 19)=3.804, #p=0.041). (J and K) Combined data from both pathways show a significant correlation between change in PPR and change in amplitude upon application of DA (J: Pearson correlation, r=−0.78, p=0.003, n=12) and upon application of DH (K: Pearson correlation, r=−0.55, p=0.035, n=15).


