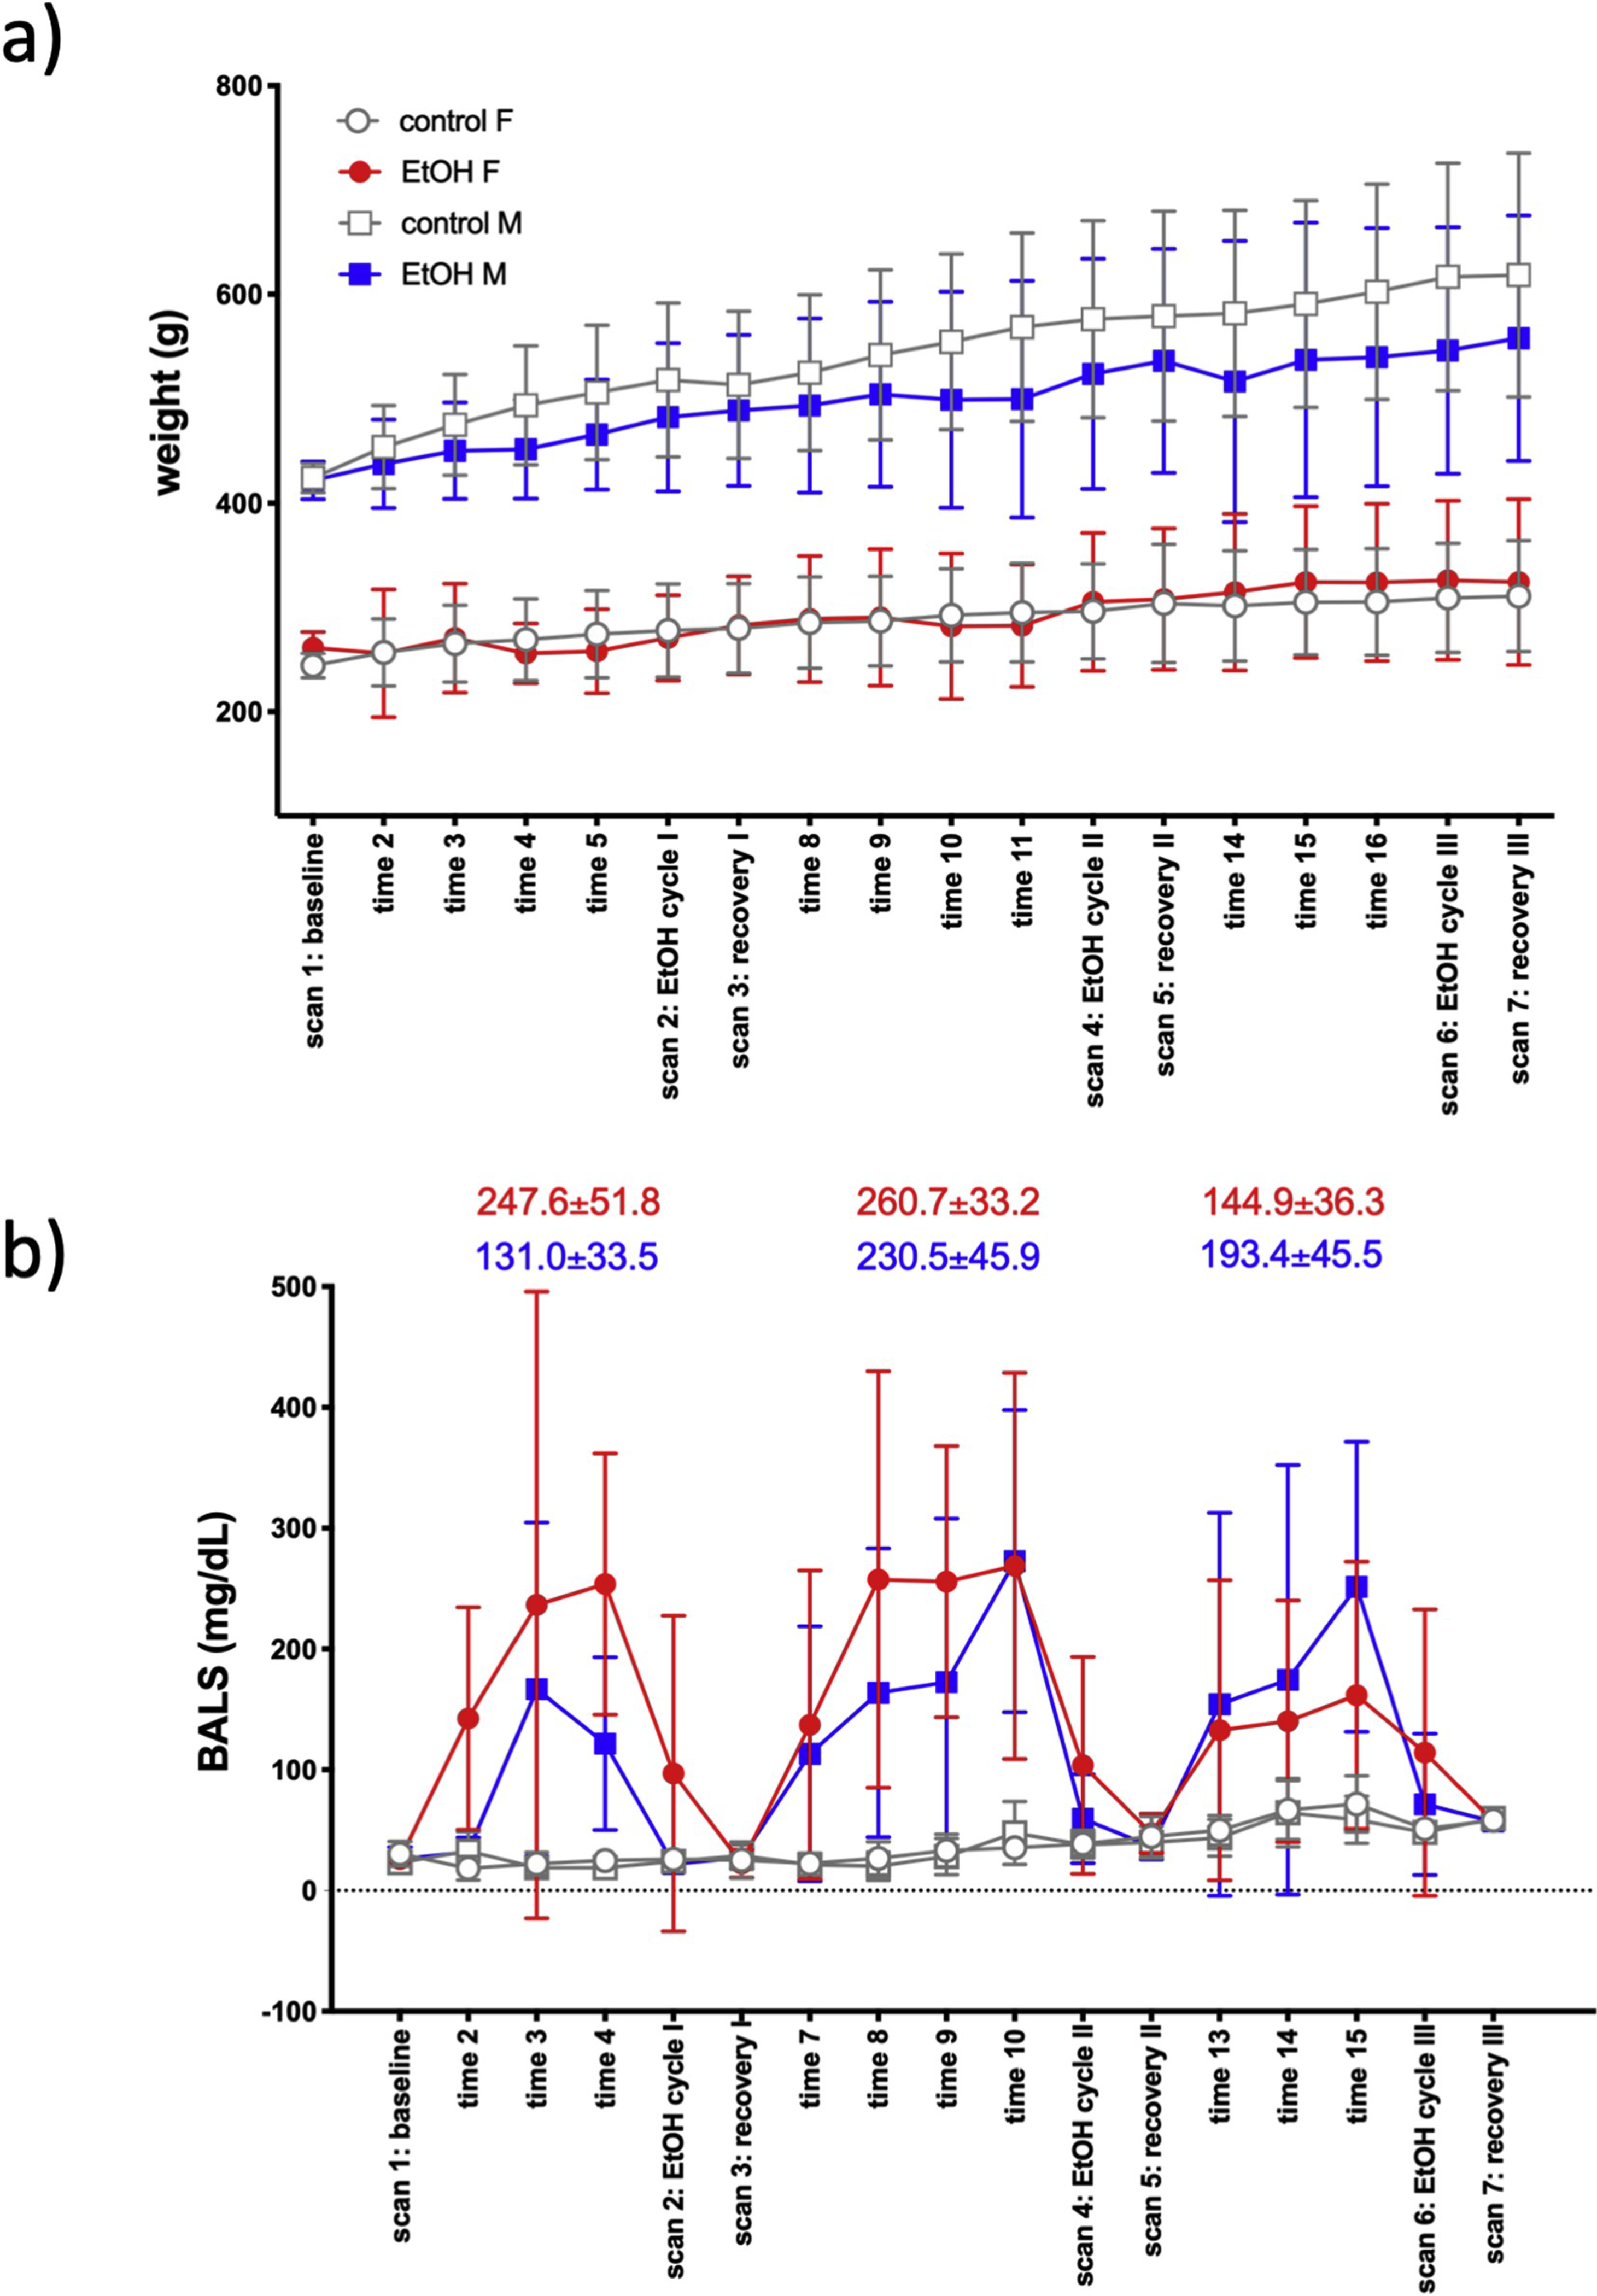
Fig. 1.

a) Weight (mean ± SD) of animals across the course of the experiment. b) Blood alcohol levels (BALs) over the course of the experiment. BALs (mean ± SD) for each EtOH cycle are presented separately for female (red) and male (blue) EtOH-exposed rats. [EtOH cycle I: average of BALs at times 3, 4; EtOH cycle II: average of times 8, 9, 10; EtOH cycle II average of times 13, 14, 15.].
