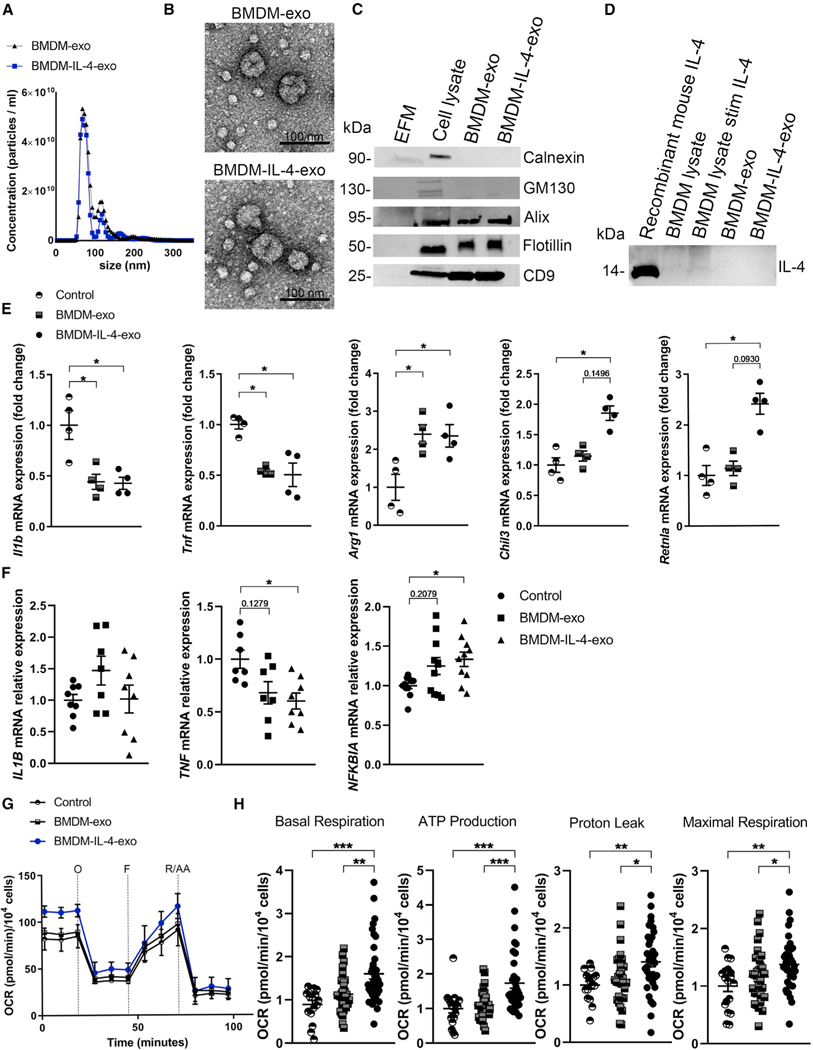
Figure 1. Isolation of Macrophage Exosomes and In Vitro Assessment of their Cell Signaling Properties.
(A) Representative size and concentration distribution of BMDM-exo or BMDM-IL-4-exo purified from BMDM cell culture supernatants after a 24 h period of culture, determined using nanoparticle tracking analysis.
(B) Electron micrograph of purified exosomes from BMDM cells. Scale bar, 100 nm.
(C) Western blot analysis of Calnexin, GM130, Alix, Flotillin, and CD9 in exosome-free media (EFM), cell lysate, and BMDM-derived exosomes (representative of three independent experiments).
(D) Western blot analysis of IL-4 in cell lysate and BMDM-derived exosomes (representative of two independent experiments).
(E) qRT-PCR analysis of Il1b, Tnf, Arg1, Chil3, and Retnla mRNA expression in BMDMs treated with PBS (control), BMDM-exo, or BMDM-IL-4-exo for 24 h. Results were normalized to B2m and Gapdh mRNA and are presented relative to control (representative of three independent measurements, n = 4 per group).
(F) qRT-PCR analysis of IL1B, TNF, and NFKBIA mRNA expression in human monocyte-derived macrophages treated with PBS (control), BMDM-exo, or BMDM-IL-4-exo for 24 h. Gene expression was normalized against GAPDH mRNA expression and converted to fold change relative to control condition (pool of two independent experiments, n = 7–10 per group). Statistical analysis was performed using the Kruskal-Wallis test and Dunn’s post-test to determine the significant difference among the three groups.
(G) Graph showing representative Seahorse mitochondrial stress tests. O, oligomycin (1 μM); F, FCCP (2 μM); R/AA, rotenone/antimycin A (0.5 μM). One representative experiment out of six experiments is shown; n = 5 per group.
(H) Bar graphs showing quantified cell-normalized mitochondrial OCR from stress tests. Results are presented relative to PBS control; pool of six independent experiments is shown; n = 20–37 in each group.
*p < 0.05, **p < 0.01, and ***p < 0.001 as determined using one-way ANOVA and Holm-Sidak post-test. Data are represented as mean ± SEM.

