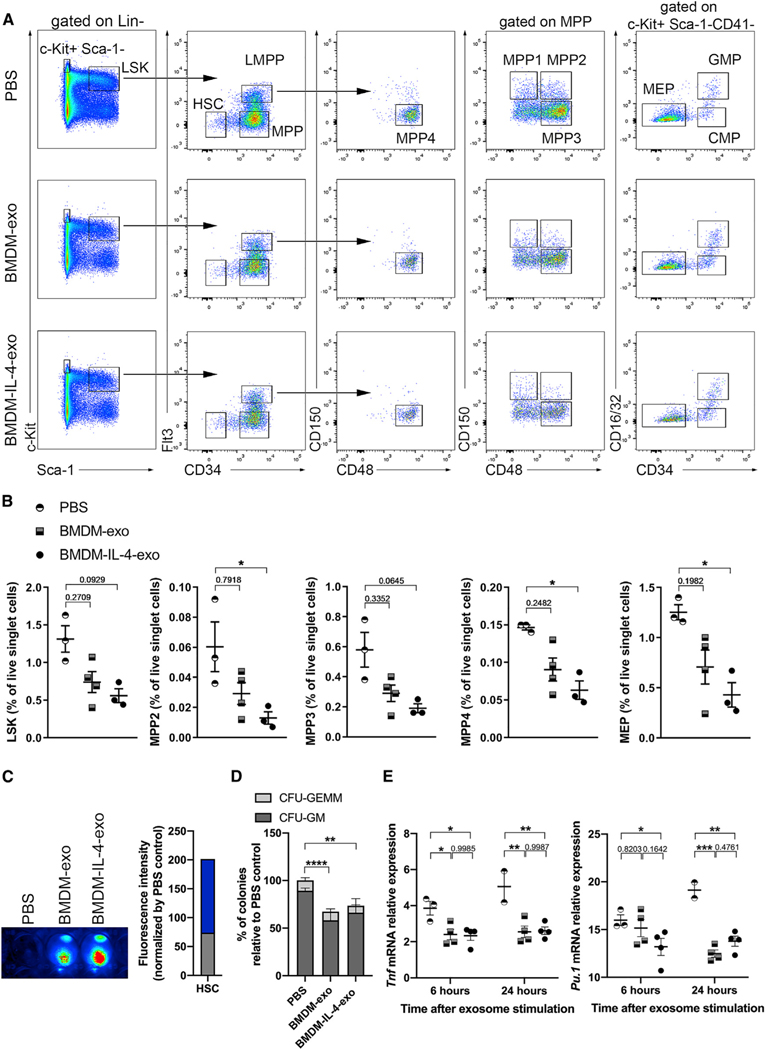
Figure 3. Hematopoiesis Control in Apoe−/− Mice Treated with BMDM-IL-4-Exo.
(A) Representative plots of flow cytometric analyses of hematopoietic stem and progenitor cells in the bone marrow of 25-week-old Apoe−/− mice fed with a Western diet injected with PBS, BMDM-exo, or BMDM-IL-4-exo (1 × 10¹⁰ particles/mouse every 2 days) for 4 weeks.
(B) Graph showing the percentages of LSK, MPP2, MPP3, MPP4, and MEP in Apoe−/− mice injected with PBS, BMDM-exo, or BMDM-IL-4-exo. One representative experiment out of three experiments is shown; n = 4 or 5 per group. Statistical analysis was performed using Kruskal-Wallis test and Dunn’s post-test to determine the significant difference among the three groups.
(C) HSCs were sorted from 25-week-old Apoe−/− mice fed with a Western diet and incubated for 2 h with DiR-labeled exosomes. The cells were subsequently washed twice with PBS, visualized, and quantified using the Odyssey Infrared Imaging System.
(D) Bone marrow (BM) cells (2 × 10⁴) from 25-week-old Apoe−/− mice were plated in methylcellulose-based medium with recombinant cytokines for colony-forming unit (CFU) and treated every 2 days with PBS, BMDM-exo, or BMDM-IL-4-exo at a dose of 2 × 10⁹ particles/mL. CFU-GEMM, granulocyte-erythroid-monocyte-megakaryocyte mixed CFU; CFU-GM, granulocyte-monocyte CFU were scored on day 12 of culture. Pool of four experiments with four separate preparations of exosome were analyzed.
(E) CD34− LSK cells were sorted from the bone marrow of 10-week-old male C57BL/6J mice and stimulated with PBS, BMDM-exo, or BMDM-IL-4-exo (2 × 10⁹ particles/mL) for 6 or 24 h, and gene expression of Tnf and Pu.1 was assessed using qRT-PCR analysis. One representative experiment out of two experiments is shown; n = 2–4 per group. Statistical analysis was performed using two-way ANOVA with Sidak’s multiple-comparisons post-test.
*p < 0.05, **p < 0.01, ***p < 0.001, and ****p < 0.0001. Data are represented as mean ± SEM.

