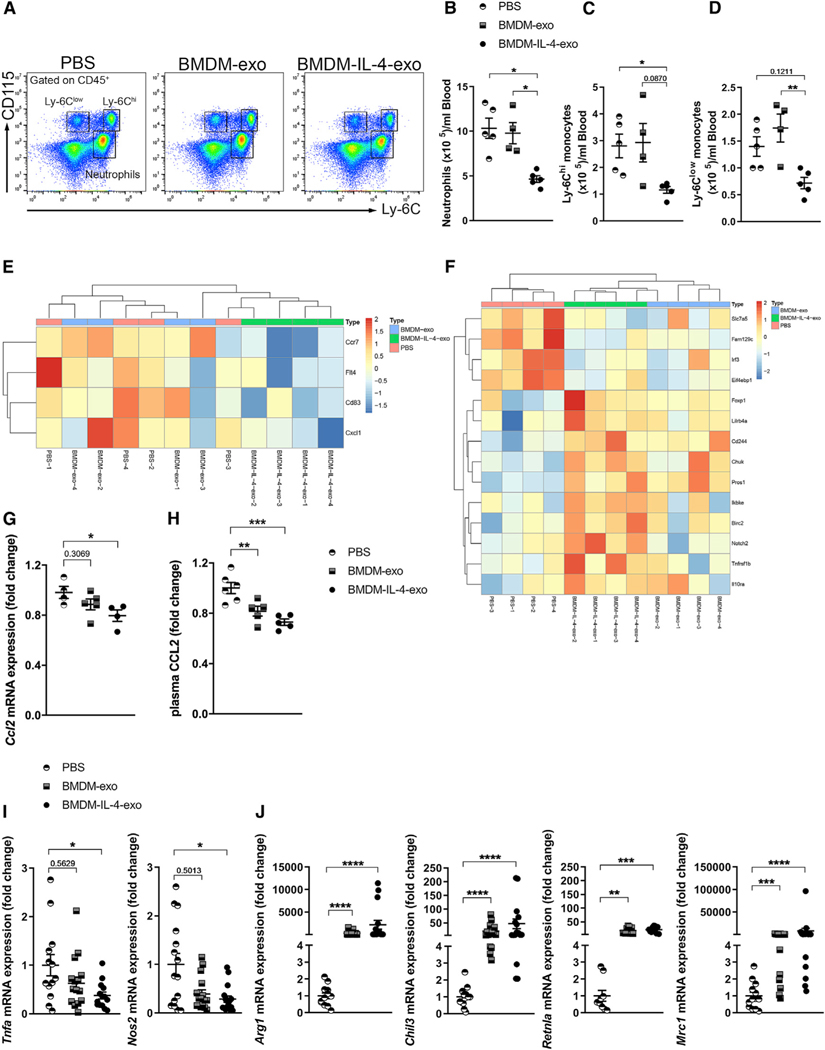
Figure 4. Treatment of Apoe−/− Mice with Macrophage Exosomes Reduces Circulating Myeloid Cells and Induces Macrophage Polarization.
(A) Representative flow cytometry plots of blood leukocyte subsets from 25-week-old Apoe−/− mice fed with a Western diet and injected with PBS, BMDM-exo, or BMDM-IL-4-exo (1 × 10¹⁰ particles/mouse every 2 days for 4 weeks).
(B–D) Quantification of (B) neutrophils, (C) Ly6Chi monocytes, and (D) Ly6Clow monocytes in BMDM-exo or BMDM-IL-4-exo compared with PBS-injected mice. One representative experiment out of three experiments is shown; n = 4 or 5 per group.
(E and F) Heatmap representation of differentially regulated genes involved in (E) cell migration and activation and (F) cardiovascular inflamamtion from Ly-6Chi monocytes sorted from the blood of Apoe−/− mice injected with PBS compared with BMDM-IL-4-exo is depicted. Gene expression was assessed using NanoString (four mice per group).
(G–J) qRT-PCR analysis of Ccl2 mRNA expression in isolated Ly-6Chi monocytes and (H) plasma measurement of CCL2 from the blood of Apoe−/− mice injected with either PBS or BMDM-exo or BMDM-IL-4-exo. (I) qRT-PCR analysis of M1-associated genes, including Tnfa, Nos2, and (J) the M2-associated genes Arg1, Chil3, Retnla, and Mrc1 in peritoneal macrophage isolated from Apoe−/− mice injected with PBS, BMDM-exo, or BMDM-IL-4-exo. Genes were normalized against B2m and Gapdh mRNA expression and converted to fold change relative to PBS-injected mice. Pool of three independent experiments is shown; n = 11–15 in each group.
Statistical analysis was performed using the Kruskal-Wallis test and Dunn’s post-test to determine the significant difference among the three groups. *p < 0.05, **p < 0.01, ***p < 0.001, and ****p < 0.0001. Data are represented as mean ± SEM.

