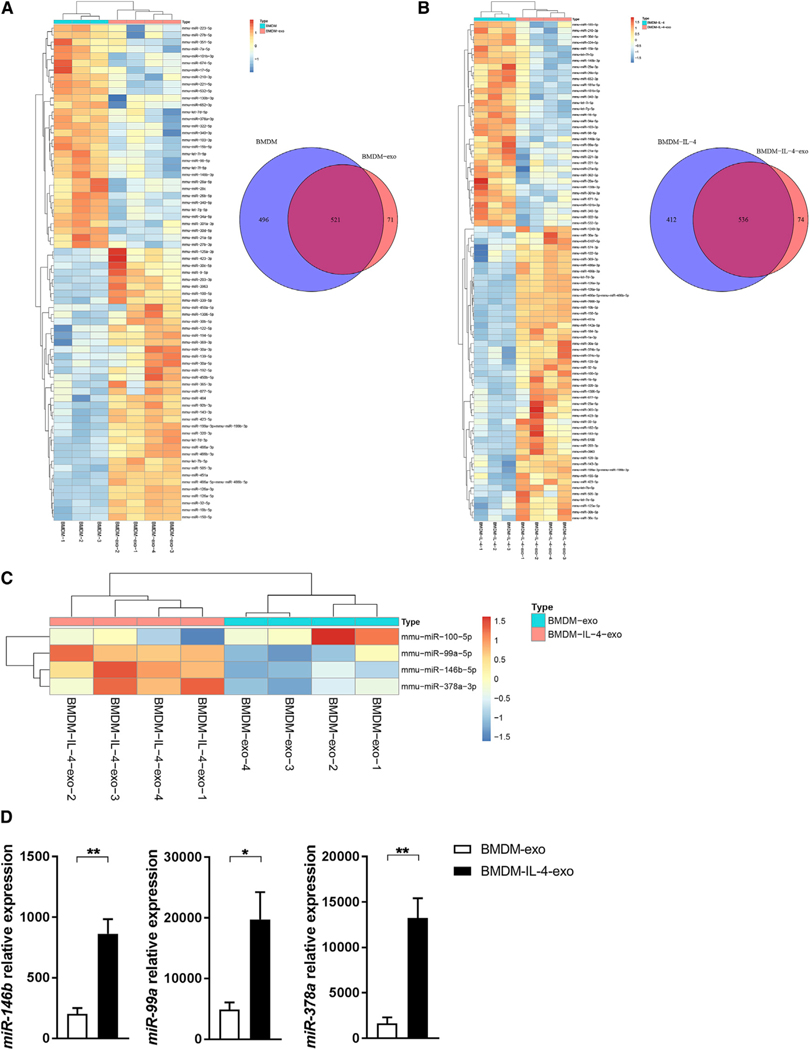
Figure 6. Polarizing Macrophages with IL-4 Modulates the Expression and Release of MicroRNA in Exosomes.
(A) Heatmap showing the distinct microRNA expression profiles between parental cells (BMDMs; n = 3) and their exosomes (BMDM-exo; n = 4). Venn diagram of unique and shared microRNAs in BMDM and BMDM-exo samples.
(B) Heatmap showing the distinct microRNA expression profiles between BMDMs stimulated with IL-4 (20 ng/mL) during a period of 24 h (BMDM-IL-4; n = 3) and their exosomes (BMDM-IL-4-exo; n = 4). Venn diagram of unique and shared microRNAs in BMDM-IL-4 and BMDM-IL-4-exo samples.
(C) Heatmap illustrating differential expression of microRNAs in BMDM-exo compared with BMDM-IL-4-exo. Red signal and blue signal indicate microRNA expression levels.
(D) qRT-PCR validation of microRNA sequencing. One representative experiment out of three experiments is shown; n = 3 per group.
*p < 0.05 and **p < 0.01 as determined by unpaired Student’s t test. Data are represented as mean ± SEM.

