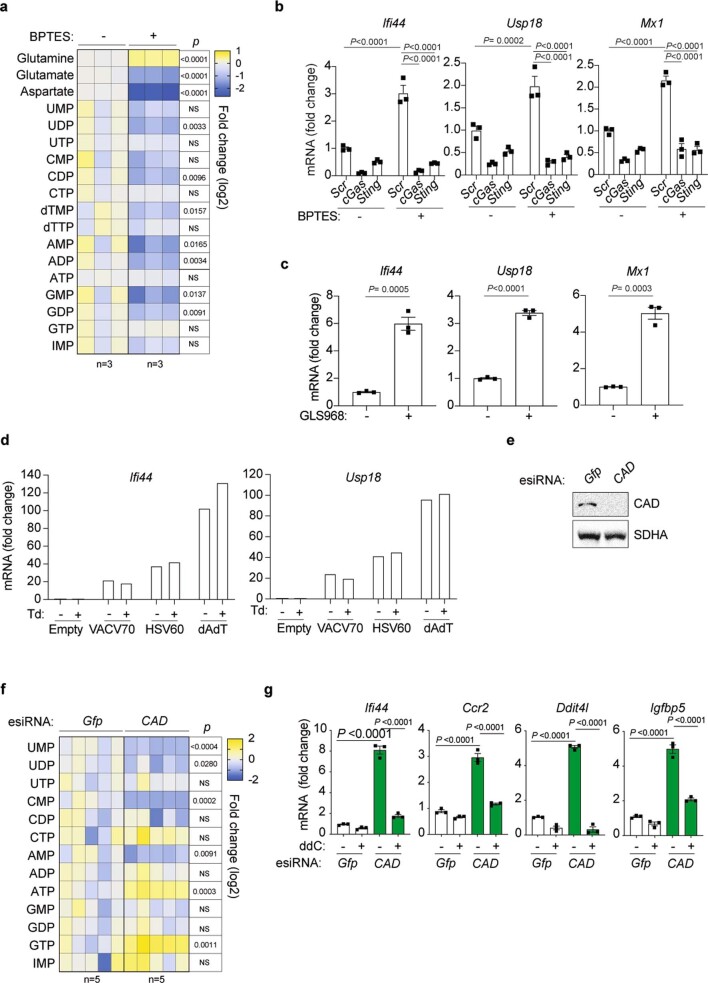
Extended Data Fig. 8. Cellular nucleotide metabolism is linked to ISG expression.
a, Nucleotide level in WT MEFs treated with 30 µM BPTES for 4 h (n=3 independent cultures). b, ISG expression in WT MEFs treated with indicated siRNAs and 30 µM BPTES for 24 h (n=3 independent cultures). c, ISG expression in WT MEFs treated with 25 µM GLS968 for 24 h (n=3 independent cultures). d, ISG expression in WT MEFs treated with 200 µM thymidine (Td) for 48 h and transfected with 2 µg of the indicated dsDNA motifs for 4 h (n=1). e, Immunoblot analysis of HeLa cells treated with indicated esiRNAs (representative immunoblot from n=3 independent cultures. f, Nucleotide level in WT HeLa cells treated with indicated esiRNAs (n=5 independent cultures). g, ISG expression in HeLa cells treated with 40 µM ddC for 6 days and the indicated esiRNA (n=3 independent cultures). P values calculated using two-tailed unpaired t-test (a,c,f); two-way ANOVA with Tukey`s multiple comparison test (b and g). NS= not significant. Data are means ± SEM.

