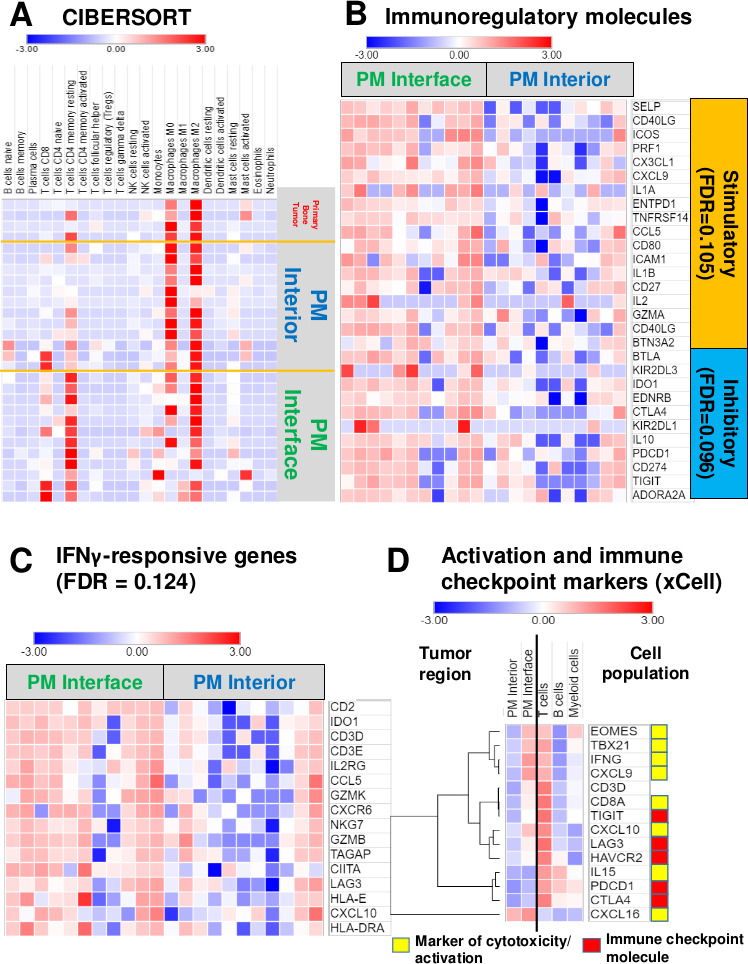
Figure 4.

Activated/exhausted lymphocyte, interferon-γ (IFNγ)-responsive and immune checkpoint molecule signatures upregulated at the pulmonary metastasis (PM) interface, but strong myeloid signature throughout the entire tumor. (A) Heatmap representing coefficients of analysis via CIBERSORT shows high CD8 T cell (p=0.0371) and CD4 memory resting T cell (p=0.002) signatures at the PM interface region. There is a slightly stronger M1 macrophage signature (statistically not significant, p=0.547) present at the interface compared with the tumor interior; however, both regions have a much stronger M2 macrophage signature overall. See online supplemental table 2 for raw data and full statistics. (B) Heatmap displaying significant genes that contribute to leading-edge of core enrichment subset via gene set enrichment analysis (GSEA) demonstrating higher expression of immune regulatory molecules at the interface compared with the tumor interior. (C) Heatmap depicting upregulated IFNγ-responsive genes present at the interface by GSEA. (D) Heatmap illustrating coefficients of xCell analysis shows higher expression of markers of cytotoxicity and activation, as well as multiple checkpoint molecules, at the PM interface, with evidence that they are being contributed chiefly by T cells. Intensity represents xCell coefficient, which corresponds to the amount that a particular region (PM interior or PM interface) or cell population (T cells, B cells, or myeloid cells) contributes to the expression of a specific gene. CIBERSORT deconvolution with the leukocyte gene signature matrix LM2221 and xCell22 were used to analyze immune and other cell composition of our data. For GSEA (B and C), genes displayed contribute to the leading-edge core enrichment subset. Expression levels were converted into heatmaps and colors quantitatively correspond to fold changes. FDR, GSEA false discovery rate q value. See online supplemental table 3 for raw rank metric scores for all genes included in GSEA and online supplemental table 4 for xCell coefficients. CIBERSORT, Cell-type identification by estimating relative subsets of RNA transcripts.
