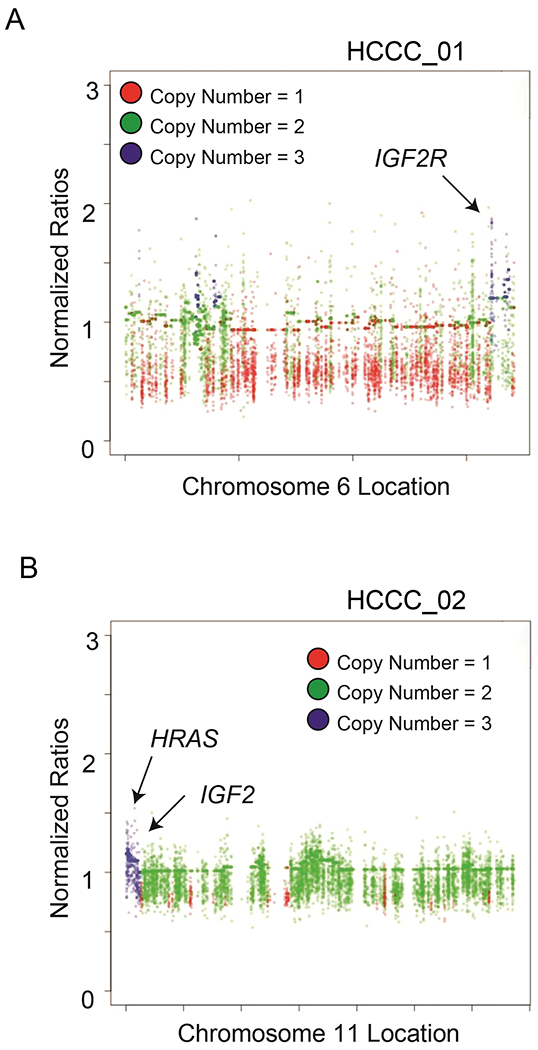
Figure 1. Identification of IGF2R and IGF2 copy number amplifications in two Hyalinizing Clear Cell Carcinomas.

A) Manhattan plot shows copy number amplifications or deletions across the HCCC1 exome sequencing data for Chromosome 6, with amplifications highlighted by blue dots and deletions annotated as red dots as indicated. Functionally prioritized genetic lesions are shown with respect to their genomic location on the plot as indicated. B) As in (A), with Manhattan plot for HCCC2 Chromosome 11.
