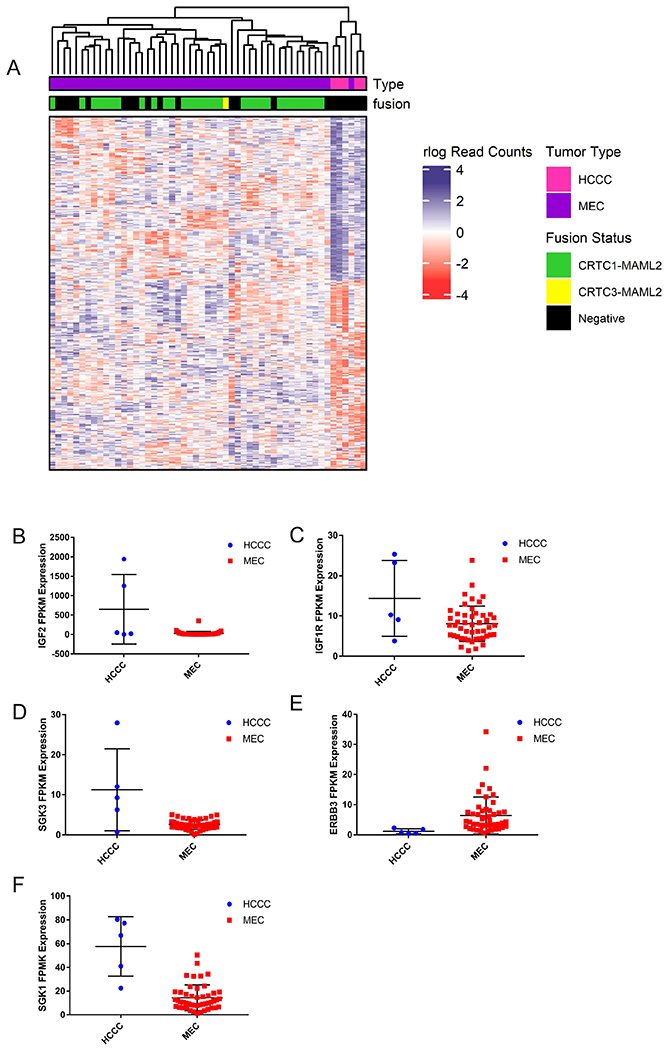
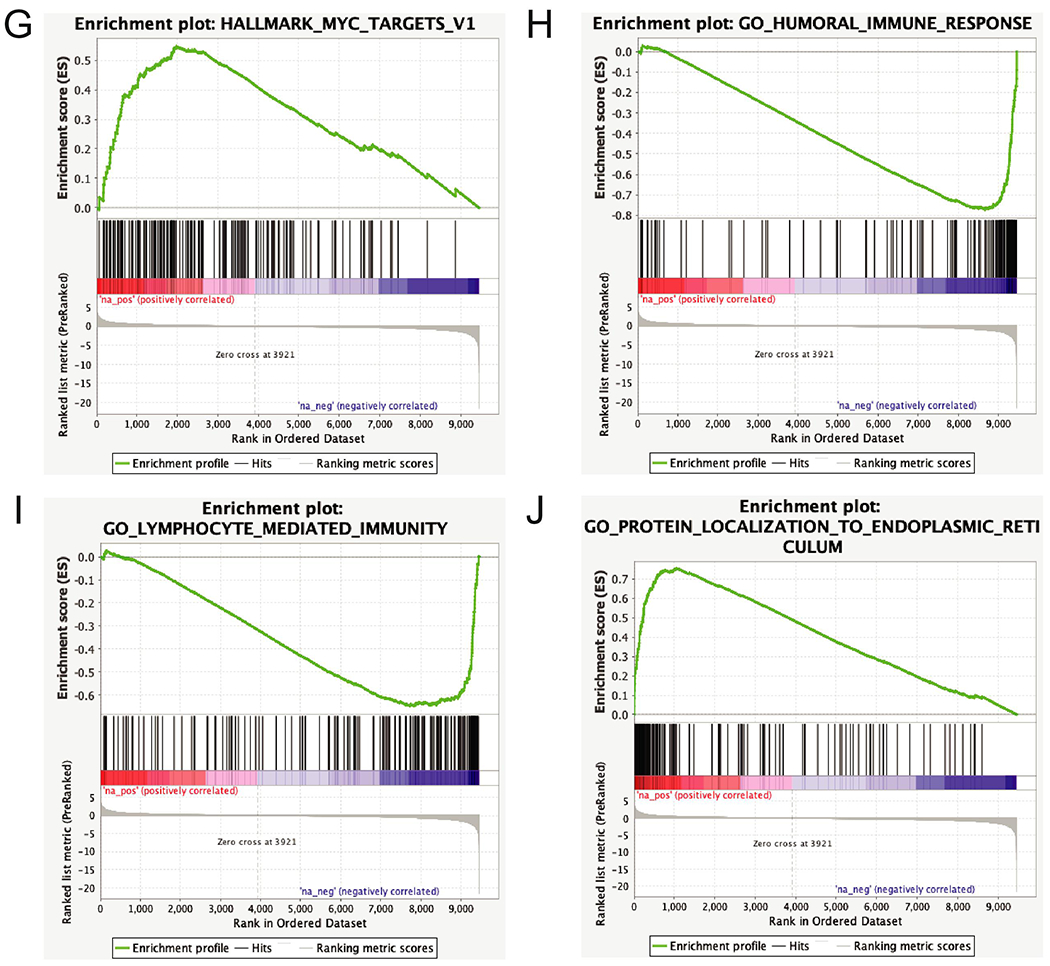
Figure 3. Identification of differential genes and pathways between HCCC and Mucoepidermoid Carcinoma.


A) RNAseq data from HCCC and 48 MECs were clustered using DESEQ2 to identify genes differentially expressed between the two tumor types, and complex heatmap was used to visualize the differential gene signature. B) Dot plot shows relative expression of IGF2 in the HCCC and MEC cases as indicated, C-F) As in (B), with IGF1R, ERBB3, SGK3, and SGK1 expression, G-J) Representative pathway enrichment analysis of gene sets differentially expressed between HCCC and MEC.
