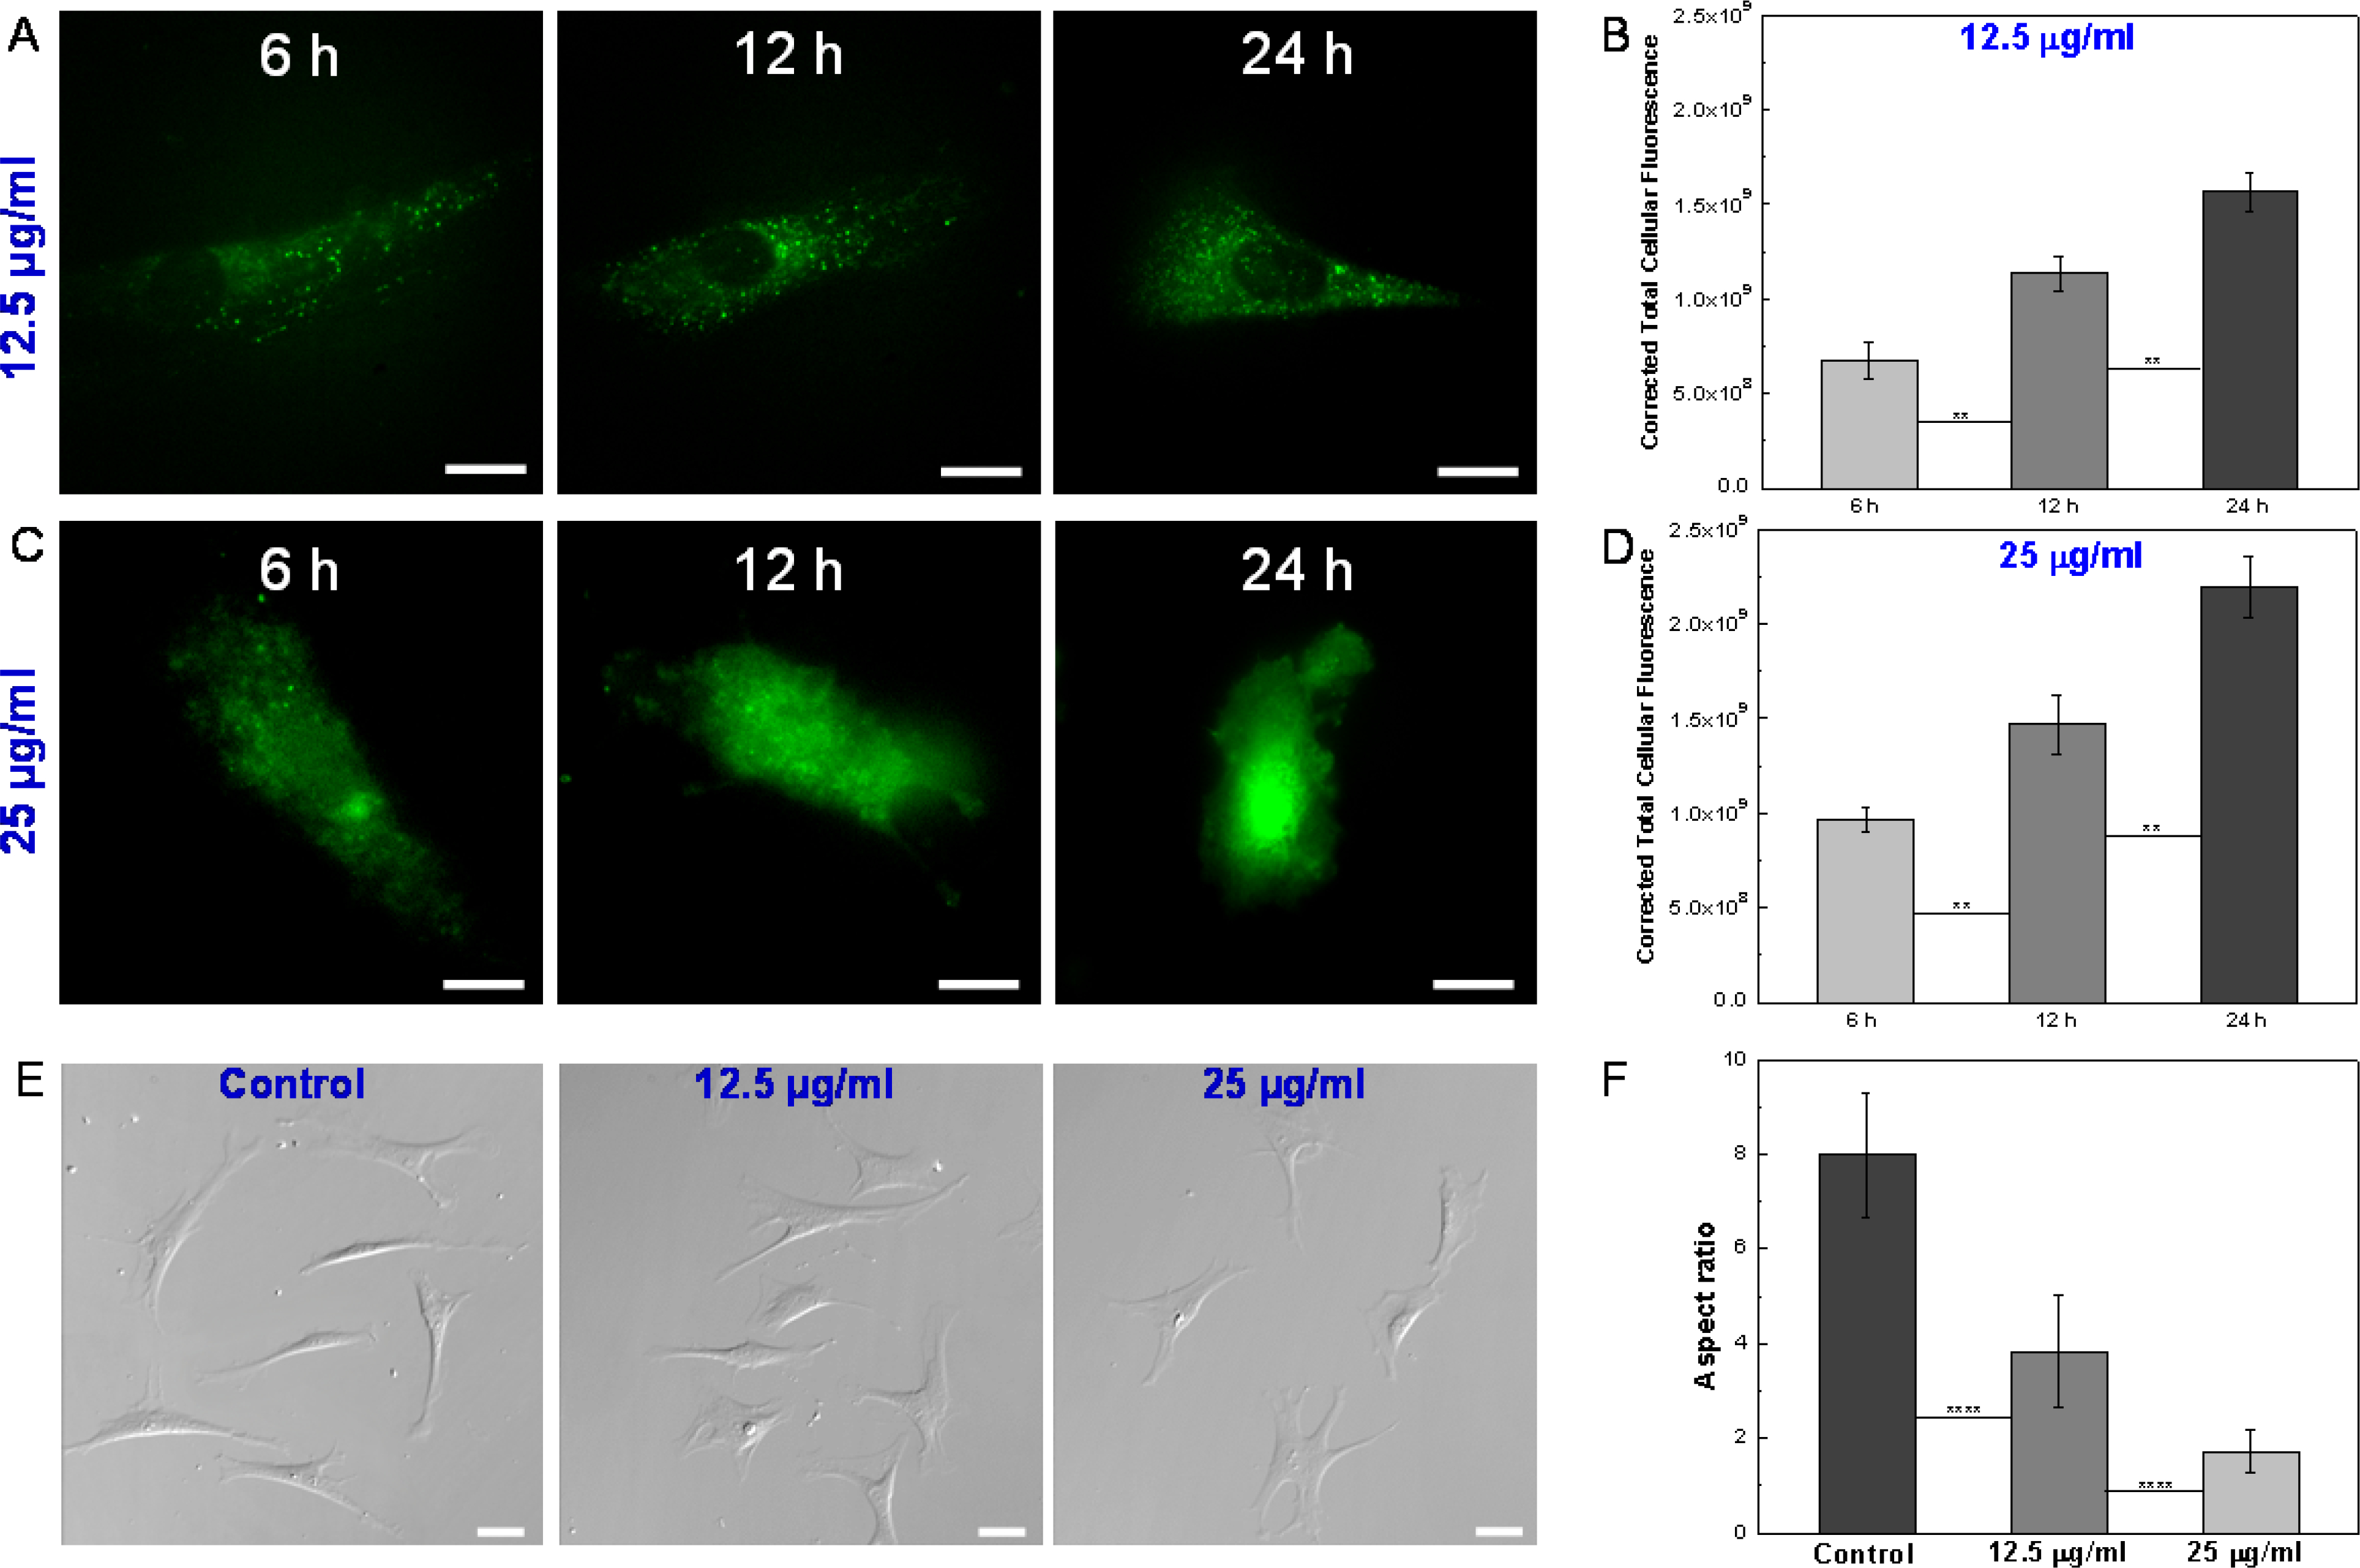
Figure 2.

(A) Fluorescence images of single VSMCs after incubation with 12.5 μg/ml FITC-loaded ZIF-8 nanoparticles for 6 h, 12 h and 24 h. Scale bars: 20 μm. (B) Quantitative analysis of cell uptake of 12.5 μg/ml ZIF-8 nanoparticles based on correlated total cell fluorescence (CTCF). Data is mean ± standard deviation, n=50. Student’s t-test, **P < 0.01. (C) Fluorescence images of single VSMCs after incubation with 25 μg/ml FITC-loaded ZIF-8 nanoparticles for 6 h, 12 h and 24 h. Scale bars: 20 μm. (D) Quantitative analysis of cell uptake of 25 μg/ml ZIF-8 nanoparticles based on CTCF. Data is mean ± standard deviation, n=50. Student’s t-test, **P < 0.01. (E) DIC images of VSMCs after incubation with 0 (control), 12.5 and 25 μg/ml ZIF-8 nanoparticles for 24 h. Scale bars: 40 μm. (F) Aspect ratios of VSMCs after incubation with 0 (control), 12.5 and 25 μg/ml ZIF-8 nanoparticles for 24 h. Data is mean ± standard deviation, n=100. Student’s t-test, ****P < 0.0001. With the increase of ZIF-8 concentrations, the cells exhibited a less elongated, and more spread shape, leading to decreased aspect ratios.
