Fig. 1.
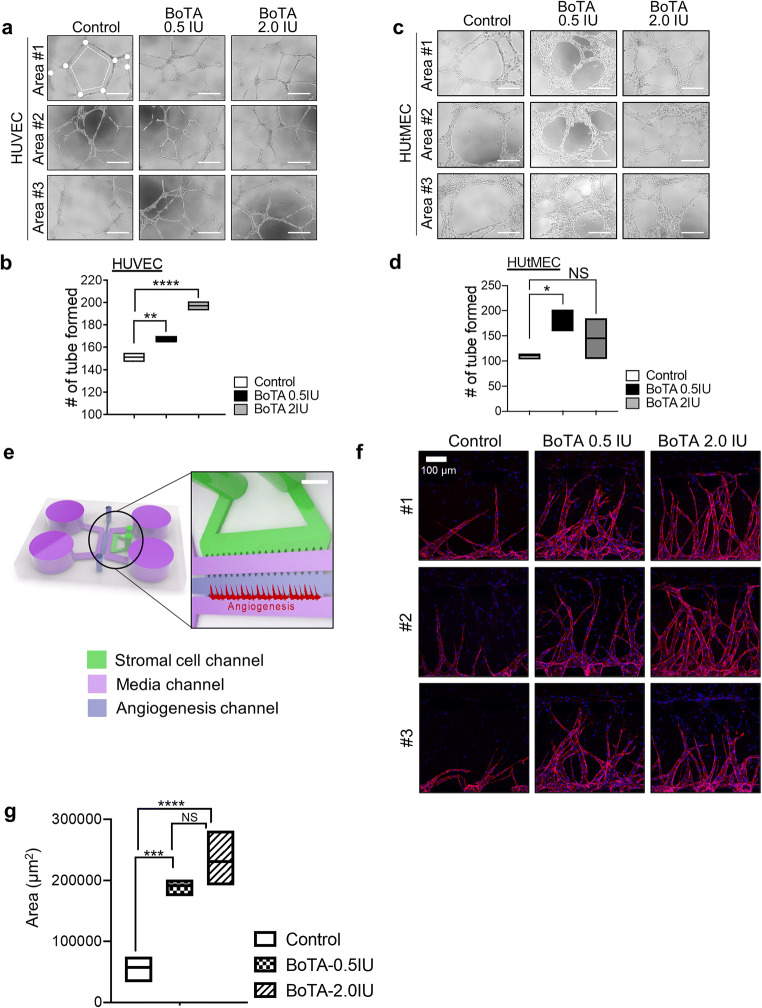
The impact of BoTA treatment on the capacity of tube formation and sprouting of endothelial cells. Representative three images showing tube formation of HUVECs (a–b) and HUtMECs (c–d) in the condition of BoTA (0, 0.5, 2.0IU) treatment for 48h. Scale bar: 200um. The total number of tube loops was quantified in graphs shown in (b) and (d). (e) A schematic diagram of a micro-engineered vascular system that was used for the analyses of angiogenic effect of BoTA. CRL4003 stromal cells were mixed in fibrin matrix and then plated in the stromal cell channel. HUVECs attached on the wall of fibrin gel were patterned in the central channel. Scale bar: 800 μm. (f) Representative confocal microscopic images of angiogenic sprouting of HUVECs in response to BoTA. Scale bar: 100 μm. The total surface area of HUVEC sprouting was quantified in a graph shown in (g). Data shown in (b), (d), and (g) are from 3 independent experiments and analyzed using the ordinary one-way ANOVA analysis with Dunnett’s multiple comparison test including P-values (*<0.05, **<0.01, ***<0.001, ****<0.0001, NS not significant)

