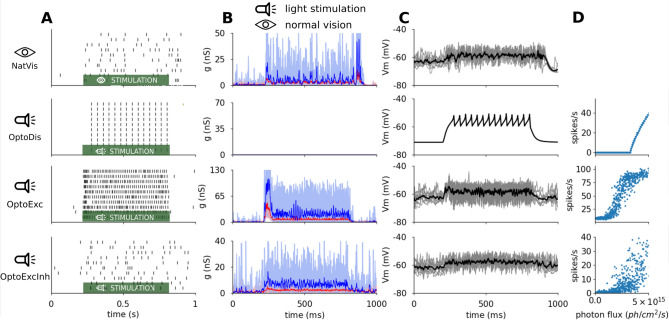
Figure 4.
Example single-neuron dynamics in the 4 experimental conditions. The neurons respond to 10 trials of stimulation with a drifting sinusoidal grating or its light-stimulation equivalent, that starts at 200 ms and stops at 800 ms. From top to bottom NatVis, OptoDis, OptoExc, and OptoExcInh conditions. (A) Spike raster plot. (B) Excitatory (red) and inhibitory (blue) conductances. (C) Membrane potential. (D) The relationship between photon-flux and the spiking response of neurons in the given condition. In (B) and (C) pale thin lines are single-trials, thick saturated lines are mean across trials. In all three optogenetic conditions an arbitrary stimulation scaling factor of photons/s/cm was used.

