
Fig. 2. Protein kinase C phosphorylation of Liprin-α3 at S760 induces phase separation.
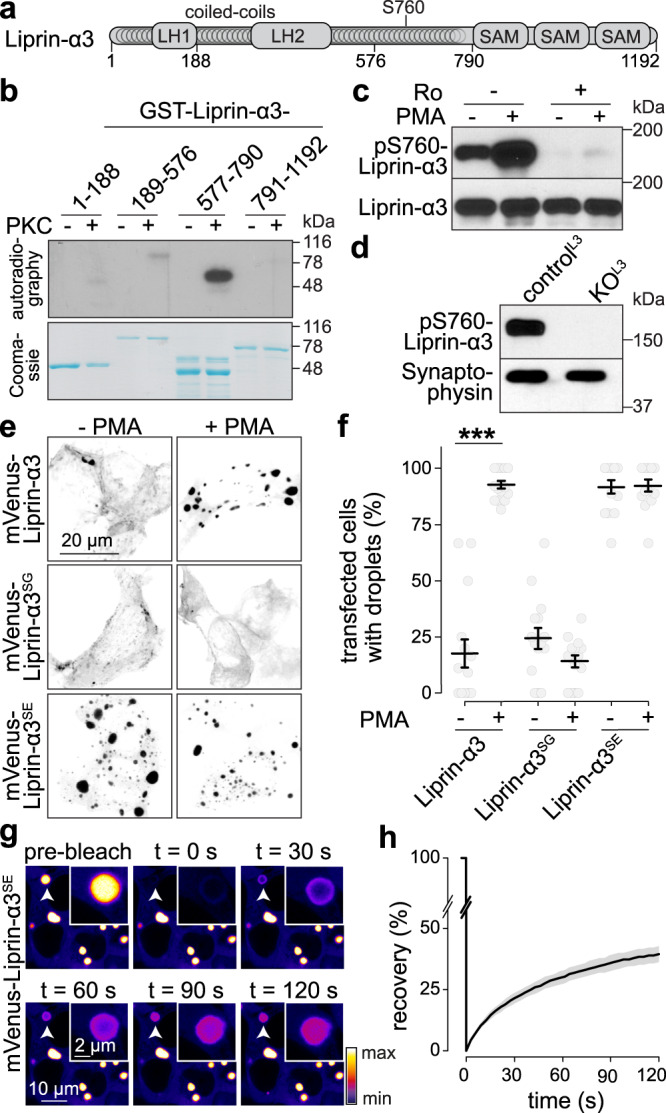
a Schematic of the rat Liprin-α3 domain structure showing Liprin homology regions 1 and 2 (LH-1 and -2), coiled-coil regions, and sterile alpha motifs (SAM). b Autoradiography (top) and Coomassie staining (bottom) of purified GST-Liprin-α3 fragments incubated with 32P-γ-ATP and with or without recombinant PKC, representative scans from two pairs of blots/Coomassie gels are shown. c Western blot of lysates of transfected HEK293T cells expressing mVenus-Liprin-α3, incubated with PMA and/or the PKC inhibitor Ro31-8220 (Ro, 1 µm), and immunoblotted with anti-phospho-S760 Liprin-α3 or Liprin-α3 antibodies that were generated for this study, scans from a single qualitative experiment are shown. d Western blot of lysates of cultured hippocampal neurons from Liprin-α3 knockout mice (KOL3) or from heterozygote control mice (controlL3), scans from a single qualitative experiment are shown. e, f Example confocal images (e) and quantification (f) of droplet formation in fixed HEK293T cells expressing mVenus-tagged Liprin-α3, phospho-dead S760G (Liprin-α3SG), or phospho-mimetic S760E (Liprin-α3SE) Liprin-α3, N = 15 images/3 independent transfections for Liprin-α3 and -α3SG, N = 14/3 for Liprin-α3SE, p values: Liprin-α3, 0.00004 (***); Liprin-α3SG, 0.39; Liprin-α3SE, 1.00. g, h Example live, time-lapse images (g) and quantification (h) of FRAP of mVenus-Liprin-α3SE condensates in transfected HEK293T cells. N = 14 droplets/3 independent transfections. Data were mean ± SEM. Significance was assessed using Kruskal–Wallis tests with Holm post hoc comparisons between all groups, and only results compared to the respective −PMA condition are reported in f. All tests were two-sided. For evaluation of additional potential phosphorylation sites, expression profile of phospho-S760 Liprin-α3 across brain areas and development, see Supplementary Fig. 2. For phase separation properties and IDR analyses of Liprin-α proteins, see Supplementary Fig. 3. For phase separation when Liprin-α2 and Liprin-α3 are co-expressed, see Supplementary Fig. 4. Source data for b–d are provided in the Source Data file.