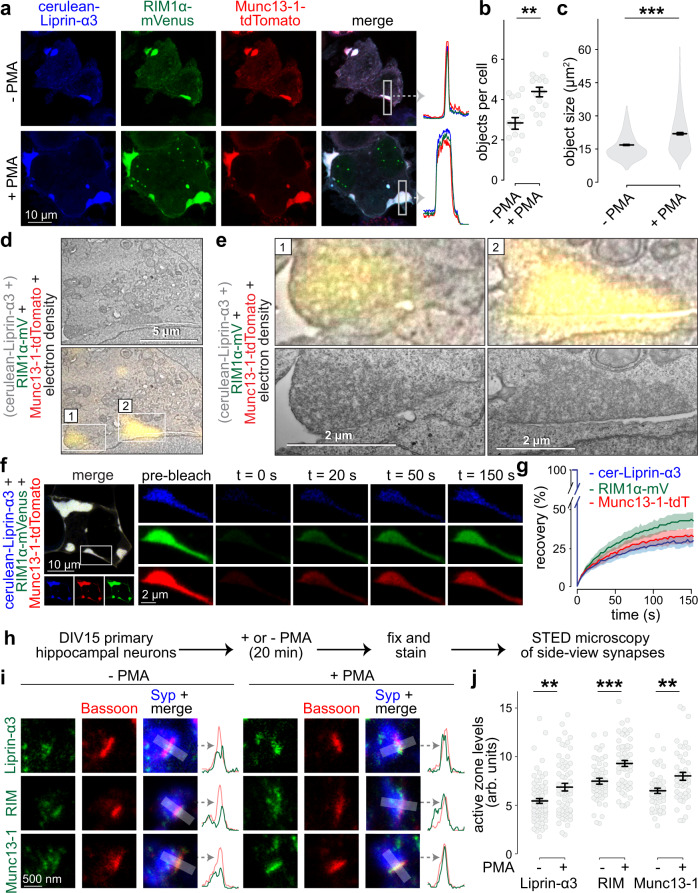
Fig. 3. Liprin-α3, Munc13, and RIM are co-recruited into phase condensates at the plasma membrane.
a–c Example confocal images including line profiles of highlighted regions (a) and quantification (b) of phase condensates in fixed HEK293T cells transfected with cerulean-Liprin-α3, RIM1α-mVenus, and Munc13-1-tdTomato in the absence or presence of PMA. Quantification of the number (b) and size (c) of protein condensates is shown, N = 276 (−PMA) or 405 (+ PMA) objects/15 images/3 independent transfections, p values: b, 0.0011 (**); c, 2e-16 (***). d, e CLEM example images of a fixed HEK293T cell transfected with cerulean-Liprin-α3, RIM1α-mVenus, and Munc13-1-tdTomato and incubated with PMA showing an overview (d) and detailed individual condensates (e) magnified from the overview image (e, top), and independently acquired images at higher magnification of the same condensates (e, bottom). Cerulean-Liprin-α3, which is consistently recruited to RIM/Munc13-containing condensates (a), is present in the transfection but not displayed because the fluorescence microscope for CLEM lacked a laser for cerulean excitation, a representative cell from two cells (two transfections) that were assessed by CLEM is shown. f, g Example of FRAP experiment (f) and quantification (g) of droplets in live HEK293T cells transfected with cerulean-Liprin-α3 (cer-Liprin-α3), RIM1α-mVenus and Munc13-1-tdTomato, N = 19 droplets/3 independent transfections. h Schematic of the assessment of effects of PKC activation on active zone assembly. i, j Example STED images (i) and quantification (j) of the intensity of endogenous Liprin-α3, RIM, and Munc13-1 at the active zone. Synapses in side-view were identified by the active zone marker Bassoon (imaged by STED microscopy) aligned at the edge of a synaptic vesicle cluster marked by Synaptophysin (Syp, imaged by confocal microscopy). Corresponding STED intensity profiles are shown on the right of each image set. Peak intensities were measured in these intensity profiles and plotted in j, shown as arbitrary units (arb. units). Liprin-α3: N = 71 synapses/3 independent cultures (−PMA) and 65/3 (+PMA); RIM: N = 55/3 (−PMA) and 54/3 (+PMA); Munc13-1 N = 46/3 (−PMA) and 47/3 (+PMA), p values: Liprin-α3, 0.0027 (**); RIM, 0.00017 (***); Munc13-1, 0.0022 (**). Data were shown as mean ± SEM. Significance was assessed using two-sided Mann–Whitney rank sum tests in b, c, and j. For assessment of single and double transfections, condensate formation in the presence of PKC inhibitors, and FRAP without PMA treatment see Supplementary Fig. 5. For STED analysis workflow, peak positions of each protein, and assessment of Liprin-α3 levels using an independent antibody, see Supplementary Fig. 6.

