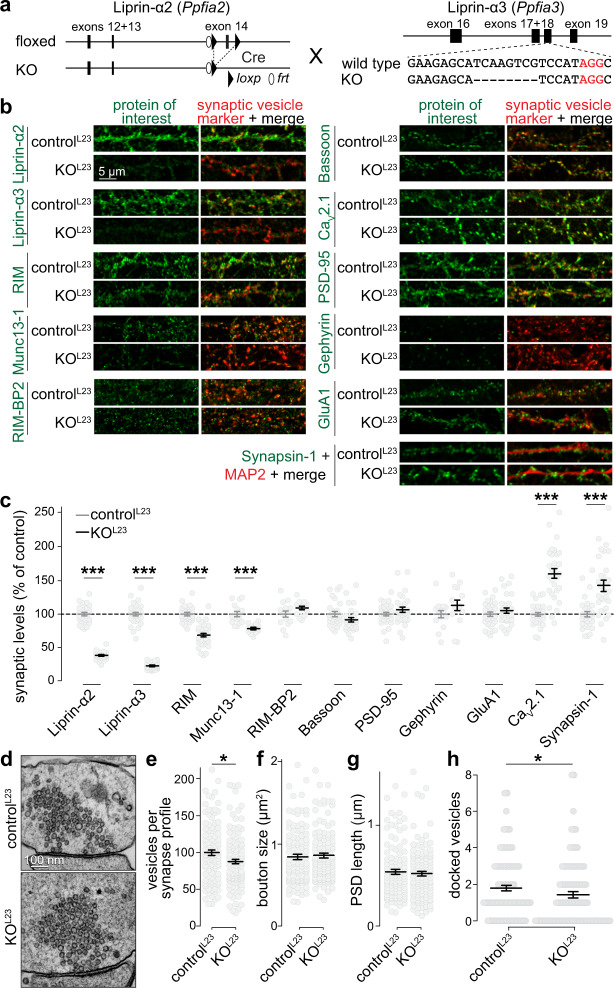
Fig. 4. Liprin-α2/α3 double knockout alters presynaptic composition and ultrastructure.
a Schematic for simultaneous knockout of Liprin-α2 and -α3. Mice in which Liprin-α2 can be removed by cre recombination (Liprin-α2f/f) were generated and crossed to previously published constitutive Liprin-α3 knockout mice (Liprin-α3−/−, generated by CRISPR/Cas9-mediated genome editing, deleted sequence is represented with dashes)19. Cultured hippocampal neurons of Liprin-α2f/f/Liprin-α3−/− mice infected with lentivirus expressing cre recombinase (KOL23) were compared to neurons of Liprin-α2f/f x Liprin-α3+/− mice infected with lentiviruses that express an inactive cre recombinase (controlL23). b, c Example confocal images (b) and quantification (c) of neurons immunostained for Liprin-α2, Liprin-α3, RIM, Munc13-1, RIM-BP2, Bassoon, CaV2.1, PSD-95, Gephyrin, or GluA1 along with Synaptophysin (for Munc13-1, RIM-BP2, and Gephyrin) or Synapsin (all others) as vesicle marker, or Synapsin-1 and MAP2. Quantification in c was performed in regions of interest (ROIs) defined by the synaptic vesicle marker and normalized to the average controlL23 levels per culture, N = 30 images/3 independent cultures per genotype per protein of interest, except for Munc13-1 (N = 15/3), RIM-BP2 (N = 14/3), and Gephyrin (N = 14/3), p values: Liprin-α2, 2e-16 (***); Liprin-α3, 2e-16 (***); RIM, 3e-11 (***); Munc13-1, 3e-05 (***); RIM-BP2, 0.54; Bassoon, 0.07; PSD-95, 0.30; Gephyrin, 0.10; GluA1, 0.53; CaV2.1, 5e-10 (***); Synapsin, 7e-06 (***). d–h Example electron micrographs of synapses (d) and quantification (per section) of the number of synaptic vesicles (e), bouton size (f), PSD length (g), and number of docked vesicles (h) of neurons fixed by high-pressure freezing followed by freeze substitution, controlL23: N = 111 synapses/2 independent cultures, KOL23: N = 124/2, p values: e, 0.02 (*); f, 0.51; g, 0.95; h, 0.02 (*). All data were mean ± SEM. Significance was assessed using Mann–Whitney U tests, except for PSD-95 and Gephyrin in c, for which t-tests were used. All tests were two-sided. For synaptic localization of Liprin-α1 to -α4, see Supplementary Fig. 7, for generation of Liprin-α2f/f mice and analysis of Synaptophysin levels of the experiments shown in c, see Supplementary Fig. 8.

