
Fig. 7. PKC phosphorylation of Liprin-α3 enhances synaptic vesicle release.
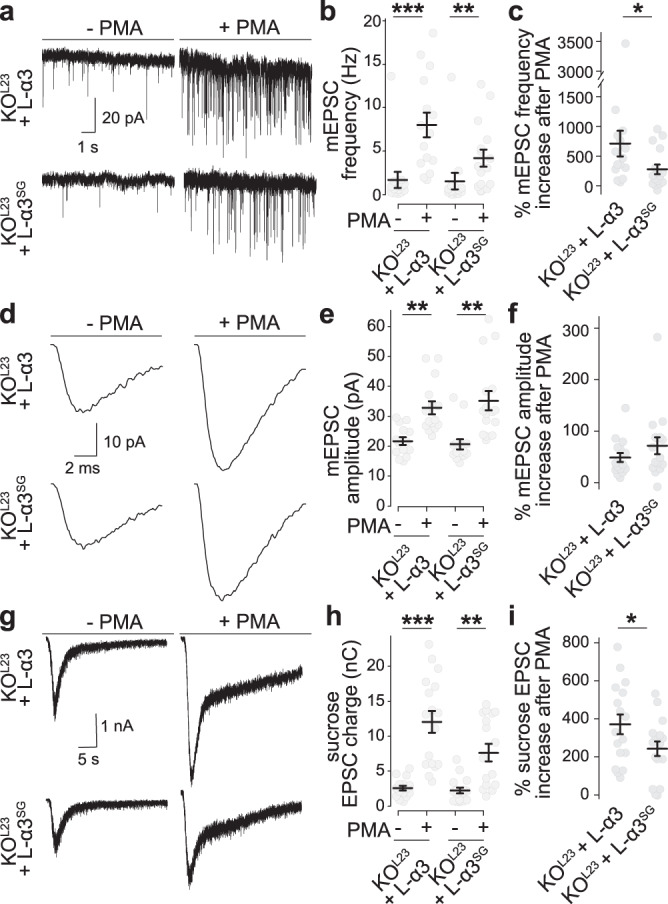
a–c Example traces (a) and quantification of mEPSC frequencies (b, c) in KOL23 neurons rescued with wild type Liprin-α3 (L-α3) or non-phosphorylatable Liprin-α3 S760G (L-α3SG) that does not form phase condensates. The percent increase upon PMA addition over naïve conditions per culture is shown in c. KOL23 + L-α3: N = 14 cells/3 independent cultures (−PMA) and 15/3 (+PMA); KOL23 + L-α3SG: N = 14/3 (−PMA) and 16/3 (+PMA), p values: b, KOL23 + L-α3, 0.0004 (***), KOL23 + L-α3SG, 0.0084 (**); c, 0.03 (*). d–f Average mEPSCs from a single cell of each condition (d) and quantification of mEPSC amplitudes (e, f). N as in b, c, p values: e, KOL23 + L-α3, 0.002 (**), KOL23 + L-α3SG, 0.001 (**); f, 0.15. g–i Example traces (g) and quantification (h, i) of the EPSC charge in response to a local 10 s puff of 500 mOsm sucrose to estimate the RRP. KOL23 + L-α3: N = 15/3 (–PMA) and 17/3 (+PMA), KOL23 + L-α3SG: N = 17/3 (–PMA) and 17/3 (+PMA), p values: h, KOL23 + L-α3, 0.00002 (***), KOL23 + L-α3SG, 0.002 (**); i, 0.03 (*). All data were mean ± SEM. Significance was assessed by Mann–Whitney rank sum test (c, f, i), or by Kruskal–Wallis test with Holm post hoc tests between all groups (b, e, h), and only results compared to the corresponding −PMA control are reported in b, e, and h. All tests were two-sided.