Figure 4.
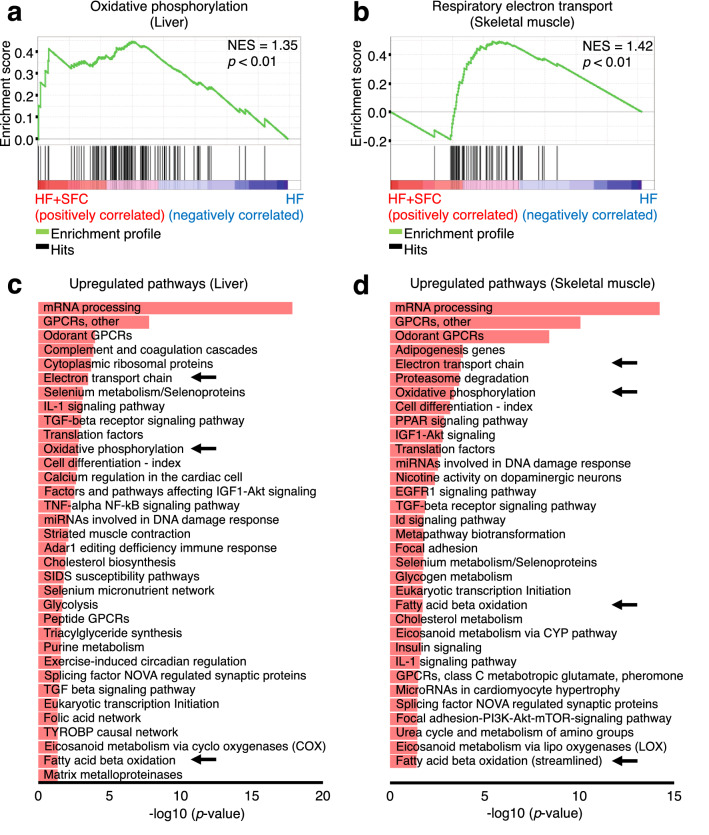
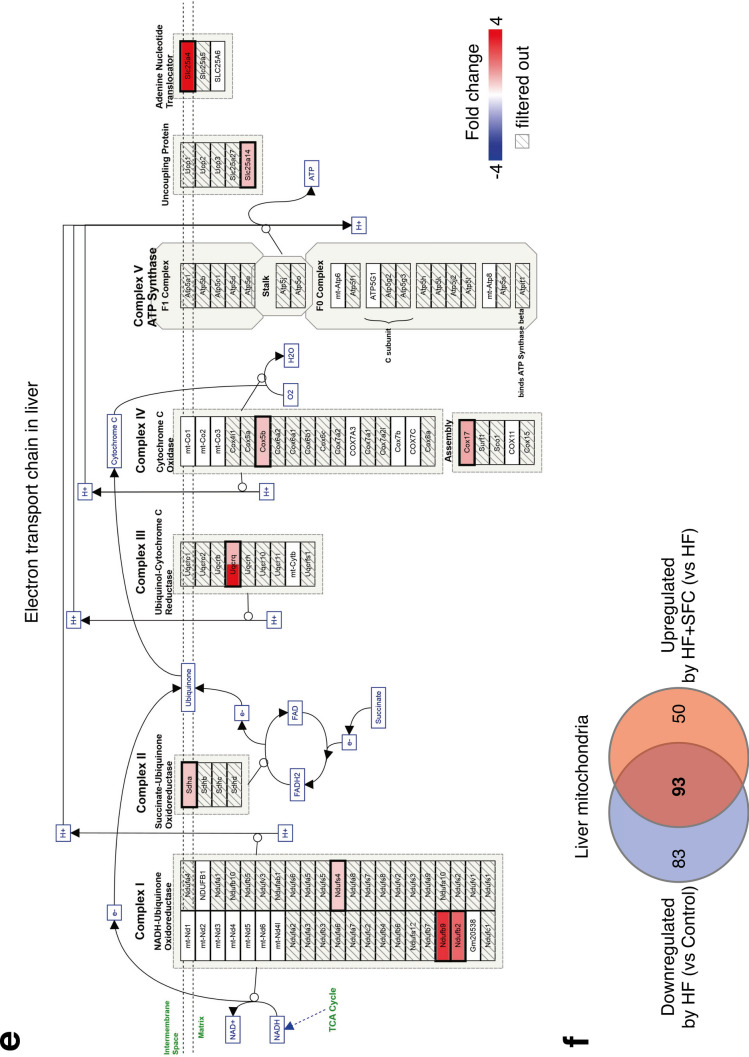
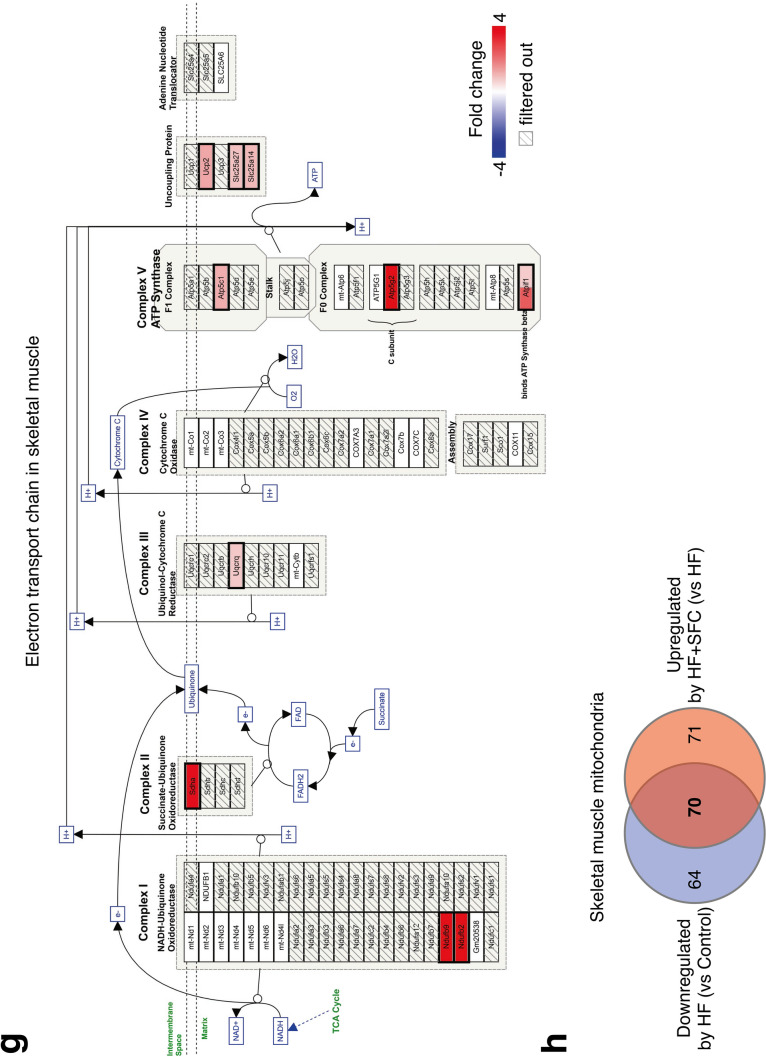
Microarray analysis shows iron supplementation improves transcription of energy metabolism and mitochondrial related genes in the liver and skeletal muscle. (a–h) Male C57BL/6J mice of 6 weeks of age were fed with each diet for 15 weeks as specified in Fig. 1. For each group, a mix of all sample cDNAs was used. (a, b) Enrichment plots of genes upregulated in HF + SFC (a) liver; and (b) skeletal muscle (compared to HF). (a) The Kyoto Encyclopedia of Genes and Genomes (KEGG) database; or (b) Reactome database was used. The analysis was performed by Gene Set Enrichment Analysis (GSEA). NES normalized enrichment score. (c, d) Pathways containing upregulated genes by greater than or equal to 1.5-fold in HF + SFC (c) liver; and (d) skeletal muscle (compared to HF) (p < 0.05). WikiPathways database was used. The analysis was performed by Transcriptome Analysis Console (TAC). (e, g) Pathway mapping for electron transport chain (ETC) in (e) liver; and (g) skeletal muscle. Upregulated genes in HF + SFC are shown as red gradations (compared to HF). The analysis was performed by TAC. The pathway mapping was created on the basis of the Wikipathways database (https://www.wikipathways.org/index.php/Pathway:WP295). (f, h) Venn diagrams representing the number of differentially expressed mitochondrial genes (greater than or equal to 1.5-fold) in (f) liver; and (h) skeletal muscle. Mitochondrial genes were based on the MitoCarta2.0 database.


