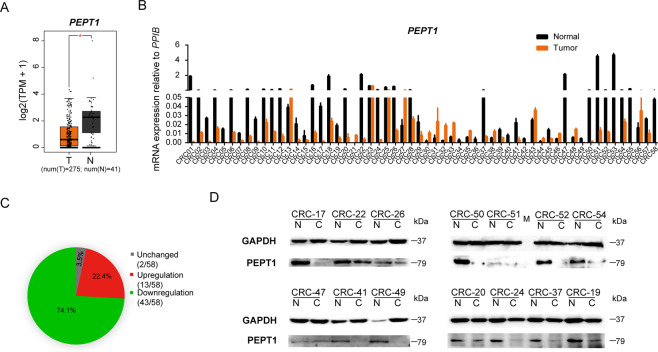
Fig. 1. The mRNA and protein expression levels of PEPT1 are frequently downregulated in CRC.
A PEPT1 expression data were provided by TCGA in GEPIA. Box plots showed PEPT1 mRNA expression in CRC tumor tissues (T) and normal tissues (N). *P < 0.05, one-tailed unpaired t-test. B The mRNA expression of PEPT1 was detected in 58 pairs of CRC and corresponding adjacent non-tumorous tissues by RT-qPCR. Data are shown as means ± SD, n = 58. C The fold change log2(T/N) of PEPT1 expression between 58 pairs of CRC and adjacent normal tissues were summarized. <−1 is downregulation, −1 to 1 is unchanged and >1 is upregulation. D Representative images of western blotting analysis for the expression of PEPT1 in 14 paired samples of CRC. GAPDH was used as a loading control.

