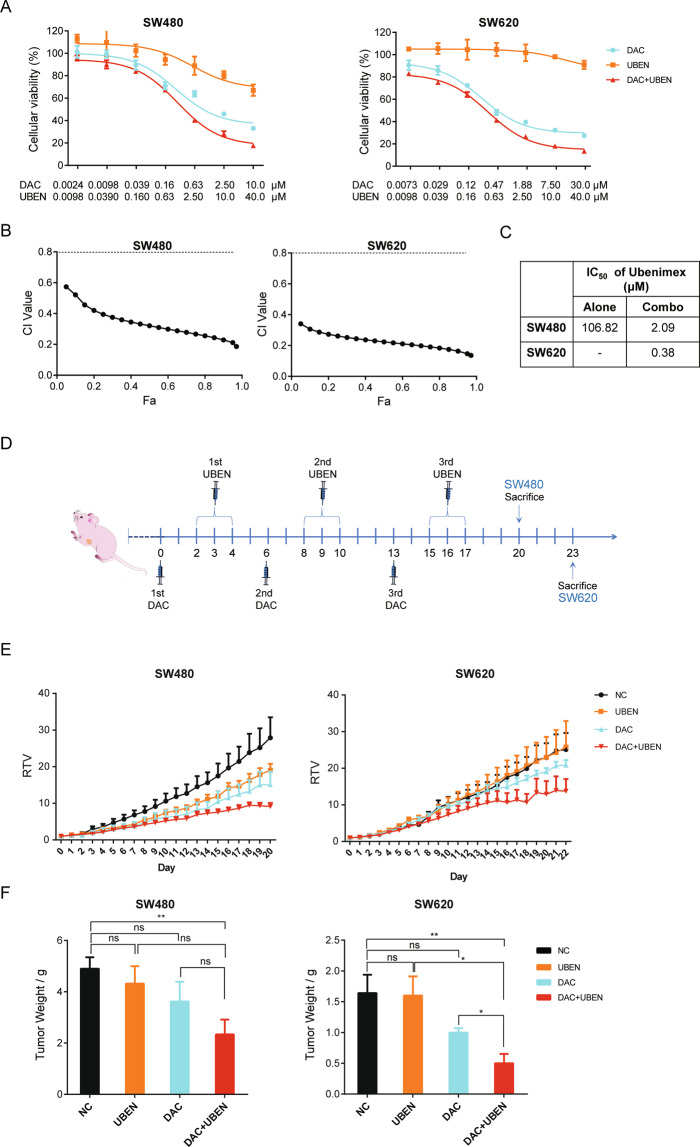
Fig. 6. Activation of PEPT1 promotes the antitumor effects of UBEN in CRC.
A Dose-effect curves of DAC, UBEN, and combination (DAC + UBEN) treatment in SW480 and SW620 cells. Cells were treated as indicated in Supplemental Table S2 and were subsequently analyzed using CCK8 assay. Data are shown as means ± SD, n = 6, nonlinear regression (curve fit) analysis. B Combination index (CI)–fraction affected (Fa) plots of DAC and UBEN combination were calculated by CompuSyn software in CRC cells. CI value is defined as follows: <0.8 is synergistic effect, from 0.8 to 1.2 is additive effect and >1.2 is antagonistic effect. C IC50 values of UBEN in CRC cells receiving combination treatment compared with UBEN alone. D Drug administration timeline and dosing schedule for xenograft models of CRC cells. E Relative tumor volume (RTV) curves in SW480 and SW620 xenograft models. Data represent the mean ± SD (n = 5). NC, UBEN, DAC, and DAC + UNEN indicate mice treated with sterile saline, ubenimex alone, decitabine alone, and decitabine-ubenimex combination, respectively. F Tumor weight of mice bearing SW480 and SW620 xenografts. Data represent means ± SD (n = 5), two-tailed unpaired t-test, ns, no significance, *P < 0.05, **P < 0.01.

