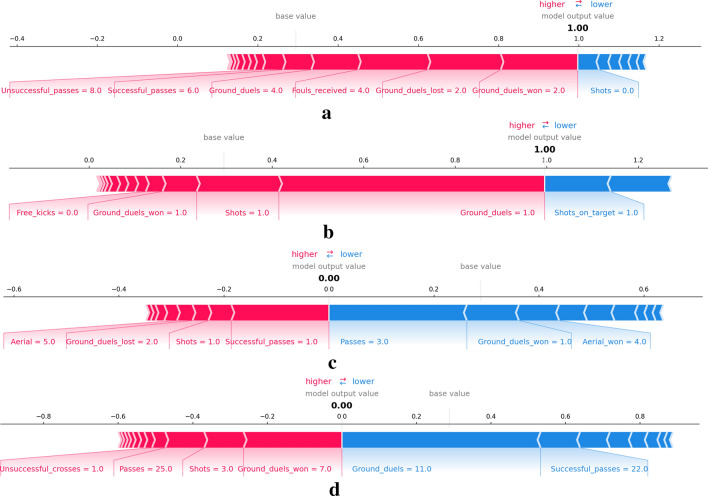
Figure 3.
SHAP force plots explaining the predicted gender of four players of the data set with female class as the reference, the model output value is the probability of that instance to be classified as class female. The base value indicates the expected value for female classes. For female predictions (a) and (b), the explainer outputs a 1.00 probability while for male predictions (c) and (c) the probability is 0.00. Red arrows indicate positive Shapley values increasing the probability and blue arrows indicate negative values decreasing the probability.

