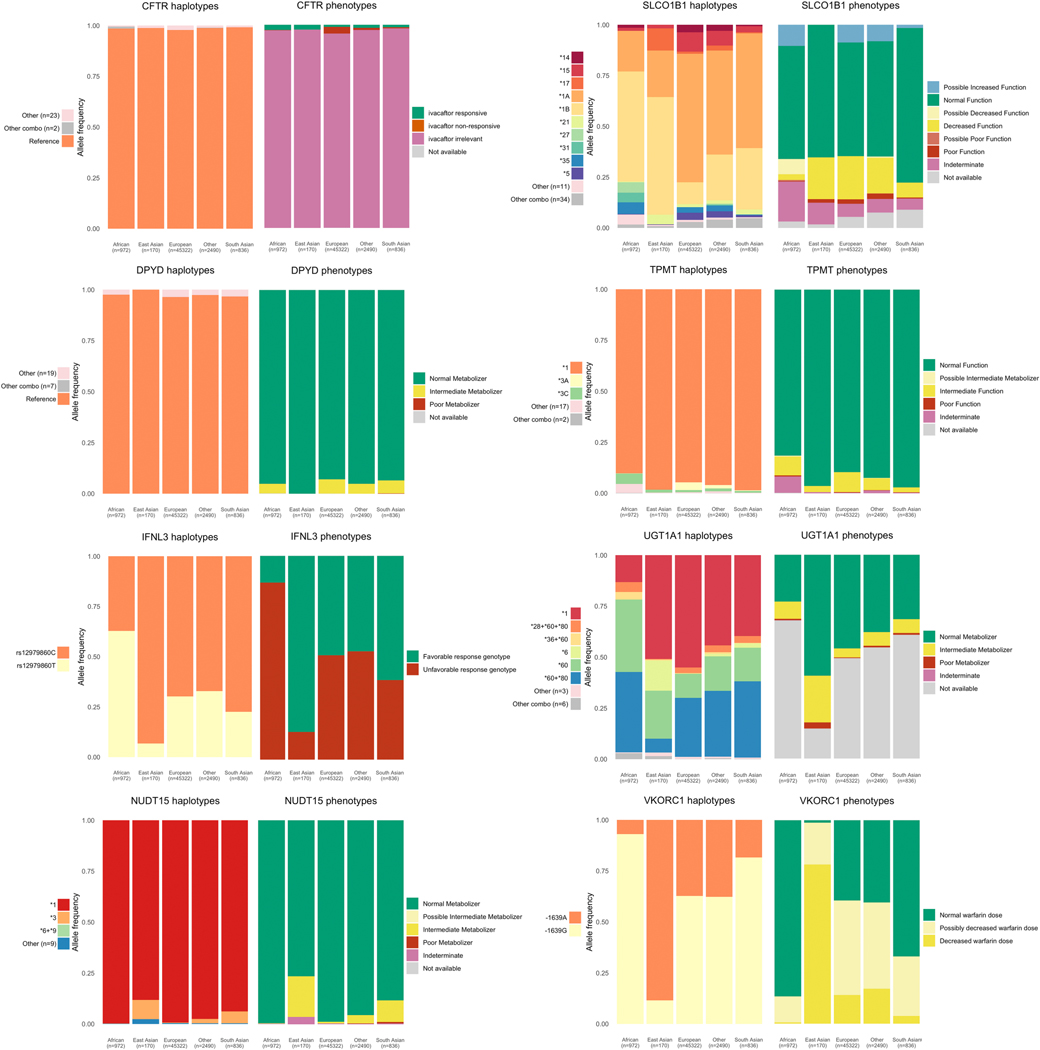
Figure 4.
Star allele and phenotype frequencies for non-cytochrome P450 genes. Frequencies shown here are generated from the integrated call set which comprises nearly 50,000 subjects. The star allele frequency plots show all star alleles occurring with a frequency of 3% or greater. Any haplotypes with under 3% allele frequency in all populations are grouped into “Other”. Combination alleles, alleles that contain either partial or full matches of more than one star allele on the same strand occurring with less than 3% allele frequency are grouped in “Other combos”. The number of alleles in “Other” and “Other combos” is shown in the legend for each gene. SLCO1B1 star alleles are determined excluding synonymous variants.

