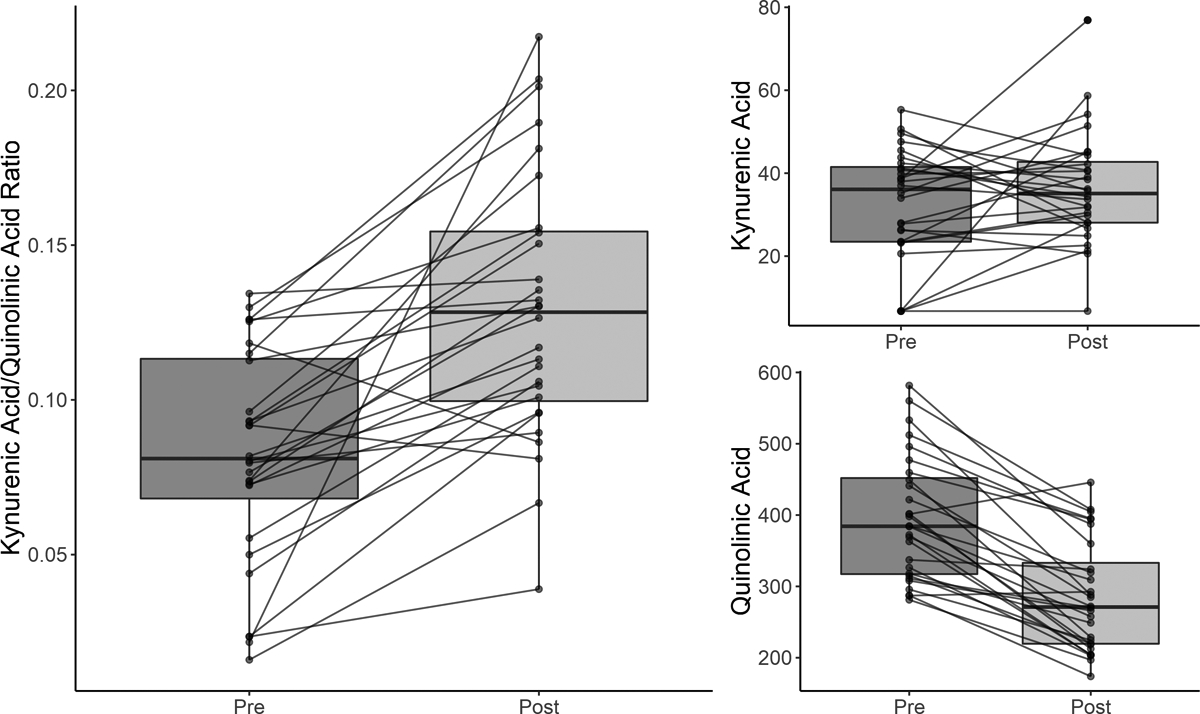
Figure 3.

Box and whisker plots showing the distribution of kynurenic acid to quinolinic acid ratios (KynA/QA) (left panel), KynA (top right panel), and QA (bottom right panel) concentrations pre-therapy and post-therapy. The solid line represents the median serum concentration. The boxes above and below the median represent the 50th-75th percentiles and the 25–50th percentiles of the scores, respectively. The vertical line (whisker) indicates the distribution of scores within 1.5 times of the interquartile range. The change in concentration pre-therapy to post-therapy is shown for each individual participant with a solid line.
