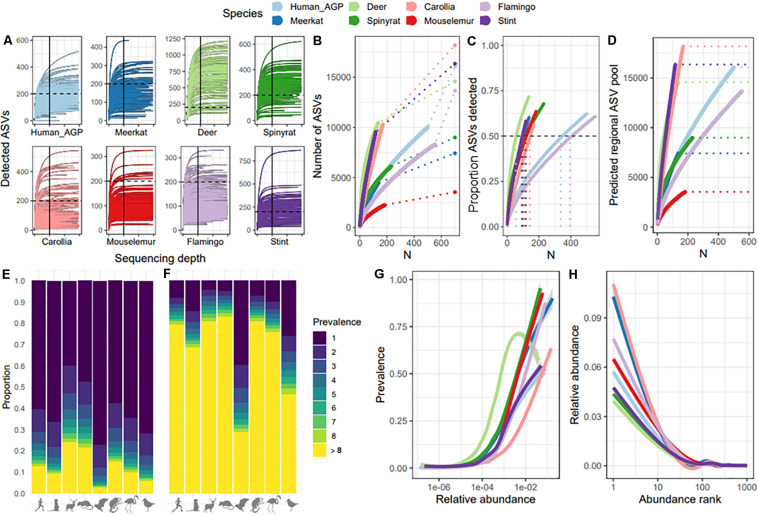
FIGURE 1.
Comparison of ASV detection rates and macroecological patterns across species datasets. (A) Rarefaction curves per species dataset, showing ASV detection with increasing sequencing depth per sample. To facilitate comparison, the 200 ASV mark is represented by a dashed line, and 10,000 reads is indicated with a solid line. X-axis ticks mark every 10,000. (B) ASV accumulation curves with sample size, showing the extent to which each additional sample increases total number of ASVs detected per species dataset. Dashed lines represent extrapolations to the total number of ASVs predicted to be within the overall ASV pool, represented by end points. (C) Percent of total (predicted) ASVs detected with increasing sample size per species dataset. The dashed horizonal line marks 50% of ASVs detected, whilst the vertical dashed lines represent the sample size required to detect 50% of predicted ASVs. (D) The relationship between sample size and predictions of the overall ASV pool. Dashed lines represent the final ASV pool prediction per dataset, which match those shown in Figure 1A. (E) ASV prevalence distribution per dataset, showing the proportion of ASVs found in just one sample (dark blue) to the proportion found in over eight samples (yellow). (F) ASV prevalence distribution per sample, showing mean proportion of ASVs per sample found in just that sample (dark blue) to proportion found in at least eight other samples (yellow). (G) Abundance-occupancy curves per dataset. (H) Rank-abundance curves per species dataset.

