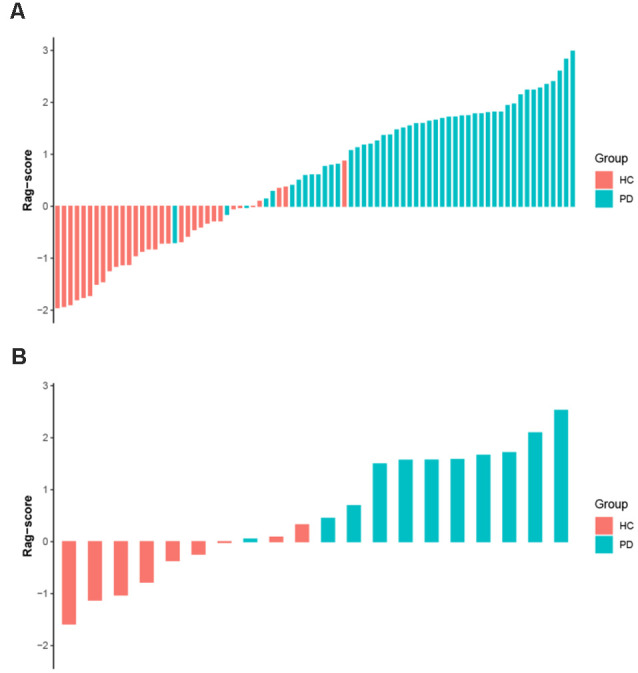
Figure 5.

The Rag-score for each subject in the primary (A) and validation (B) sets. Red bars represent the HC group and blue bars represent the PD group. The greater the score, the more likely it is to be PD. Rag-scores, radiomic signature scores; HC, healthy control; PD, Parkinson’s disease.
