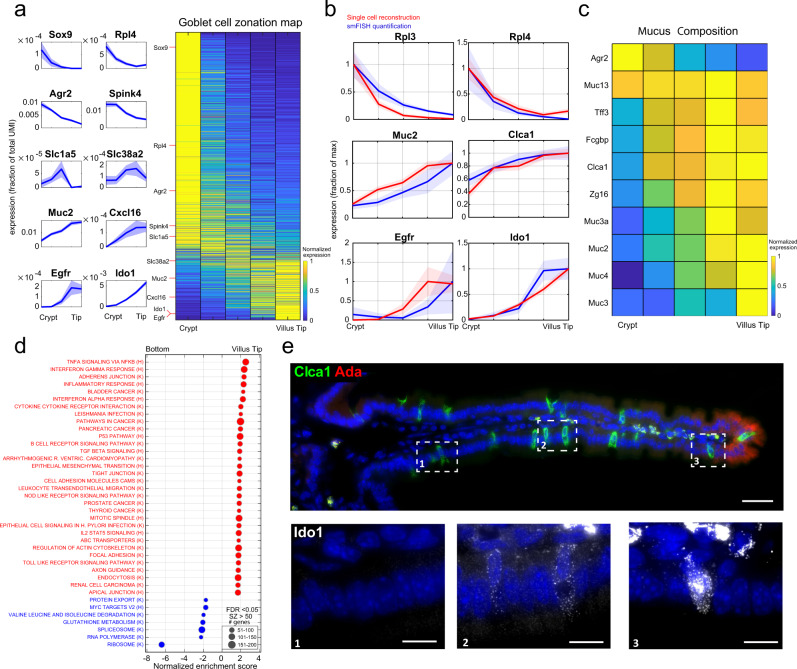
Fig. 3. Spatial reconstruction of goblet cells.
a Reconstructed zonation profiles based on single goblet cells. Profiles are normalized to their maximum across zones. Plots on the left show zonation profiles of representative crypt (Sox9, Rpl4, Agr2, Spink4), mid-villus (Slc1a5, Slc38a2) and villus tip (Muc2, Cxcl16, Egfr, Ido1) genes. Light areas denote the SEM. b Validation of the reconstructed zonation profiles using smFISH. Blue line shows smFISH mean expression level, red line the reconstructed profile based on the single cell analysis. Light patches denote the SEM. Source data are provided as a Source data file. c Heatmap of zonation profiles of genes related to mucus composition. Profiles are normalized to their maximum across zones. d Gene set enrichment analysis53 for hallmark (H) and KEGG (K) pathways (FDR < 0.05), tip enriched sets are in red, bottom enriched sets are in blue. e smFISH image of zonated genes Clca1 (green) and Ido1. Ada (red) marks the villus tip, blue the DAPI-stained nuclei. Bottom insets show Ido1 mRNAs (gray dots) increasing from the bottom (1) to middle (2) and tip (3) villus zones. Images representative of n = 10 villi (5/mouse). Scale bar, 50 μm in the stitched image and 15 μm in the insets.

