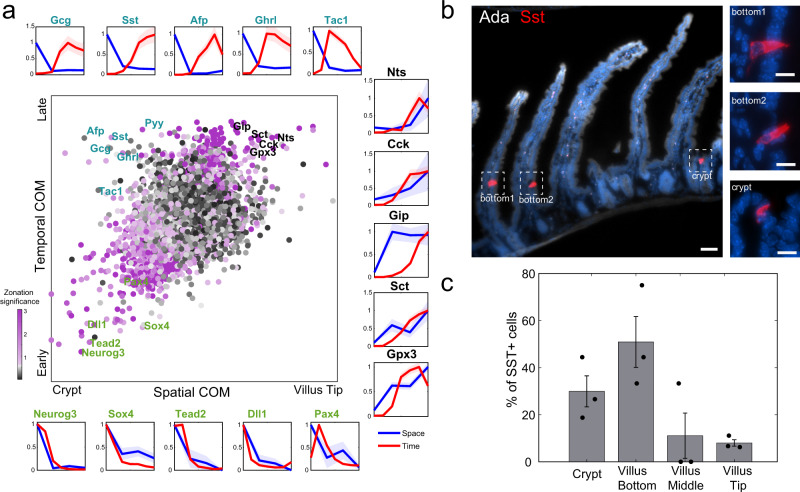
Fig. 5. Migration pattern of eneteroendocrine lineages.
a Spatio-temporal analysis of enteroendocrine cells. Central plot: Scatter plot of the center of mass (COM) in our spatial zonation reconstruction vs. temporal COM based on single cell time stamps form Gehardt et al.12 (“Methods”). Dots colored by ‒log10(spatial zonation q-value). Peripheral plots show reconstructed temporal (red) and spatial (blue) profiles for early crypt-confined genes (green fonts, bottom row), intermediate-late crypt/villus bottom-confined genes, expressed in cells that might be migrating more slowly (cyan fonts, top row) and late villus-localized genes, expressed in cells that might be migrating more rapidly (black fonts, right column). Light areas in plots denote the SEM. b Representative smFISH images of the enteroendocrine crypt-zonated gene Sst (red). Insets are blow-ups of the Sst+ cells at the crypt and bottom villus. Ada in gray marks the villi tips. Scale bars, 50 μm in the large image and 10 μm in the insets. c Quantification of Sst+ enteroendocrine D-cells in crypt and villus bottom, middle and tip over 3 mice. Fisher exact test (two-sided) for the frequencies of D-cells between the two lower zones and two upper zones p = 3.8 × 10⁻⁵. Data are presented as mean values ± SD. Source data are provided as a Source data file.

