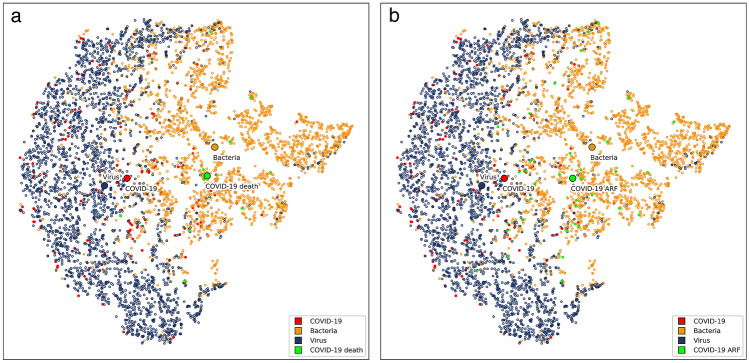
Figure 3.
Visualization of bacteria/virus/COVID-19 parameter space with t-SNE method. Each dot represents a patient or more specifically, an embedding of his/her blood parameters into a two-dimensional space, and its color represents the group. Blue dots represent patients with viral infections other than COVID-19, orange dots patients with bacterial infections and red dots patients with COVID-19. Green dots in panel (a) represent COVID-19 patients who died (10 patients) and in panel (b) COVID-19 patients diagnosed with acute respiratory failure (38 patients). Medoids of bacteria/virus/COVID-19/”COVID-19 death” groups on panel (a) and bacteria/virus/COVID-19/”COVID-19 ARF” groups on panel (b) are also marked.

