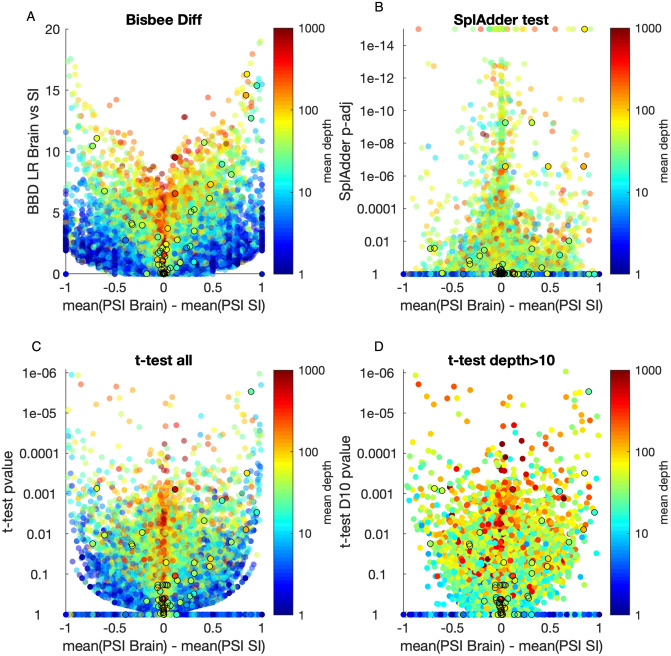
Figure 4.
Volcano plots of brain versus small intestine for four differential splicing methods. Differential splicing results for the brain versus small intestine comparison from the Wang et al. dataset. The Bisbee Diff LR (A), SplAdder test adjusted p value on a log scale (B), or t-test p value on a log scale (C,D) are plotted against the difference in mean PSI between the brain and small intestine samples. Points are colored by the mean read depth covering the event on a log scale as indicated by the color bar. Events with mass spectrometry confirmed tissue specific protein expression are outlined by black circles.

