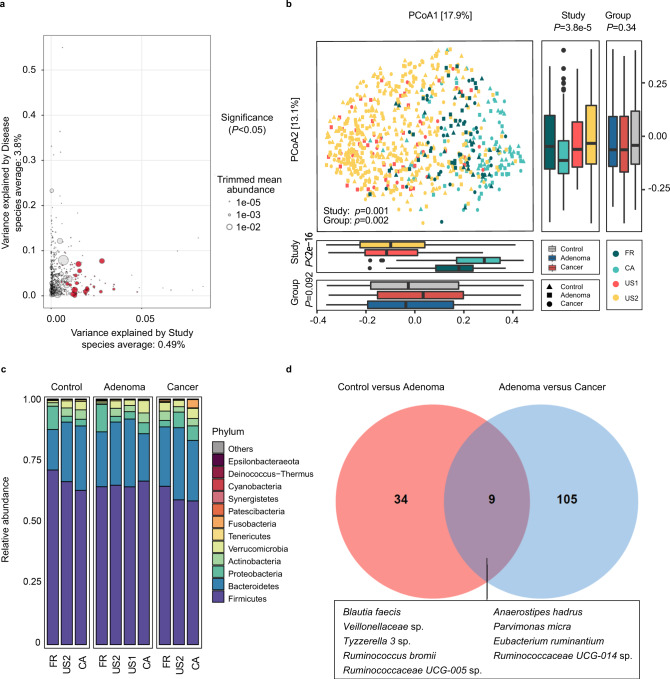
Fig. 1. Alterations of gut microbial composition in different disease status.
a Variance explained by disease status (adenoma versus cancer) is plotted against variance explained by study effects for individual ASVs. The significantly differential ASVs are colored in red and the dot size is proportional to the abundance of each ASV. P values were from a two-sided blocked Wilcoxon rank-sum test. Source data and exact P values are provided as a Source Data file. b Principal coordinate analysis of samples (control, n = 252; adenoma, n = 306; cancer, n = 217) from all four studies based on Bray–Curtis distance, which shows the fecal microbiota composition was different among studies (P = 0.001) and groups (P = 0.002). P values of beta diversity based on Bray–Curtis distance were calculated with PERMANOVA. The study is color-coded and the group (control, adenoma, and cancer) is indicated by different shapes. The upper-right and the bottom-left boxplots illustrate that samples projected onto the first two principal coordinates broken down by study and disease status, respectively. P values of the first and second principal components were calculated with a two-sided Kruskal–Wallis test for study and group. All boxplots represent the 25th–75th percentile of the distribution; the median is shown in a thick line at the middle of the box; the whiskers extend up to values within 1.5 times of IQR, and outliers are represented as dots. Source data are provided as a Source Data file. c Relative proportions of bacterial phyla in healthy controls, adenomas, and CRC across four different studies. d Venn diagram shows the overlap of differential ASVs assigned at species level between adenomas and healthy controls or CRC.

