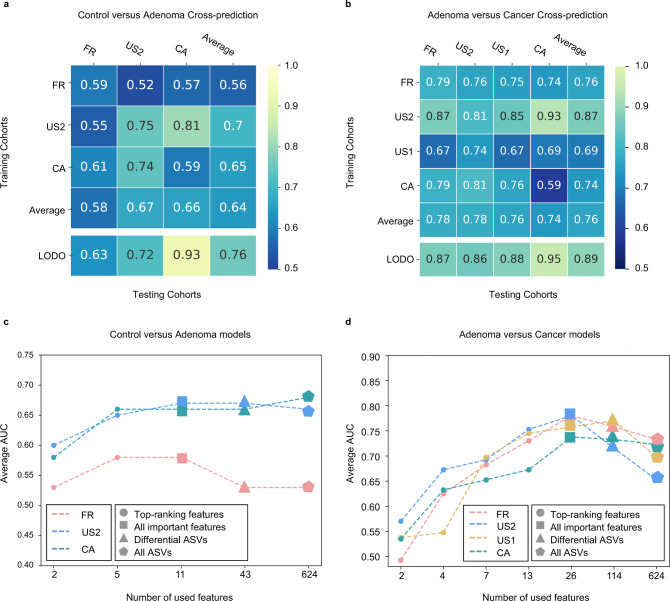
Fig. 3. Prediction performance of important features across studies and identification of minimal features for detecting adenoma.
a, b, Cross-prediction matrix detailing prediction values for differentiating adenoma from control using bagging K-Nearest Neighbors classifiers (a) and CRC using RF models (b) as AUC obtained using important features. Values on the diagonal refer to the results of cross-validation within each study. Off-diagonal values refer to the AUC values obtained from cross-cohort validation, which training the classifier on the study of the corresponding row and applying it to the study of the corresponding column. The LODO values refer to the performances obtained by training the classifier using all but the study of the corresponding column and applying it to the study of the corresponding column (see “Model evaluation” section). The study-to-study and LODO validation values for differentiating adenoma from control using RF models can be found at Supplementary Fig. 9. c, d Average AUC of study-to-study transfer validation classifiers for control versus adenoma (c) and adenoma versus cancer (d) with different sets of features. Input features were indicated as different shapes, top-ranking features, all important features signed, differential ASVs and all ASVs were represented by circles, squares, triangles, and pentagons, respectively. The x axis in c and d indicate different numbers of features. Colors represent different studies. Source data are provided as a Source Data file.

