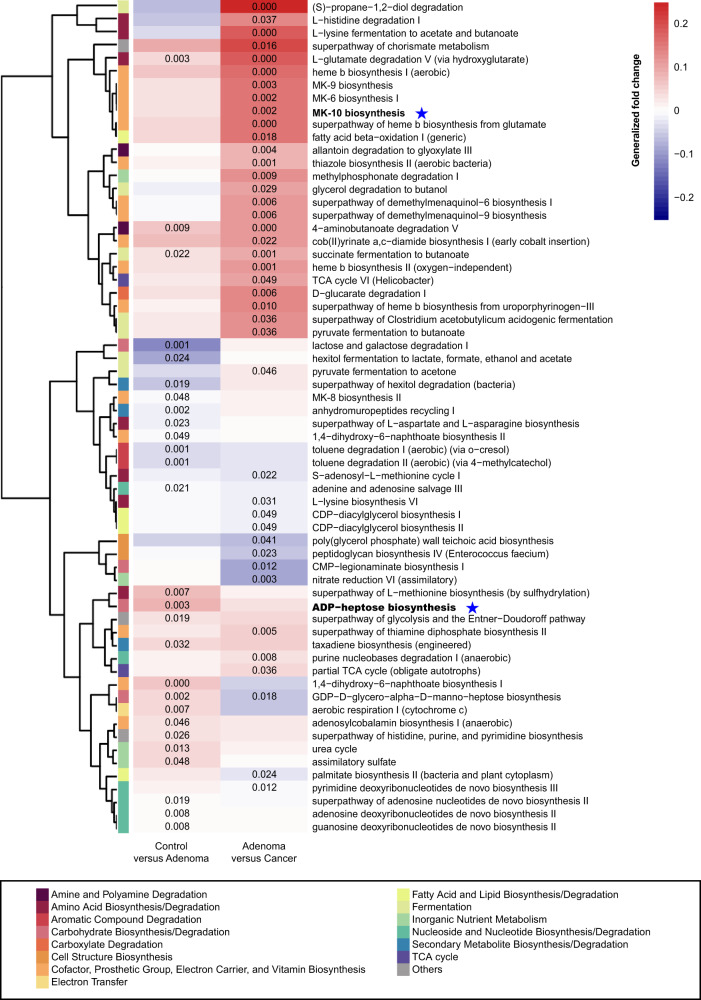
Fig. 4. Functional alterations in control, adenoma, and cancer.
The relative abundances of functional pathways were compared between adenoma and control or cancer. Differentially abundant pathways were plotted; P values were computed using a two-sided blocked Wilcoxon rank-sum test and the exact P values < 0.05 were presented in the heatmap. Generalized fold change (see “Meta-analysis of differentially abundant ASVs” section) was indicated by color gradients. The generalized fold change > 0: enriched in the latter; generalized fold change < 0: enriched in the former. Source data are provided as a Source Data file.

