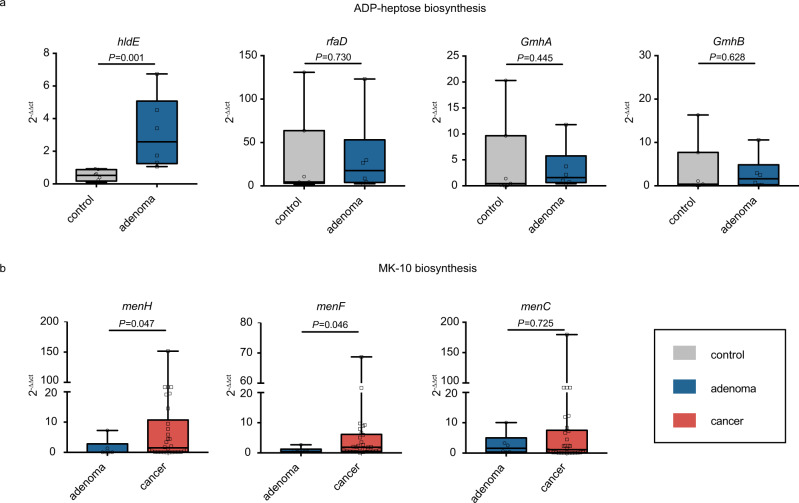
Fig. 5. Relative abundance of candidate genes.
Plotted values are qRT-PCR quantifications of bacterial genes in the ADP-heptose and MK-10 biosynthesis. The abundances of a hldE, rfaD, GmhA, and GmhB were compared between control (n = 7) and adenoma (n = 6) groups, while the abundances of b menH, menF, and menC were compared between adenoma (n = 6) and cancer (n = 30) groups. All boxes extend from 25th to 75th percentiles and whiskers show the minimum and maximum values. Lines at the middle of each box show the median. P values were computed using a two-sided Wilcoxon rank-sum test. Source data are provided as a Source Data file.

