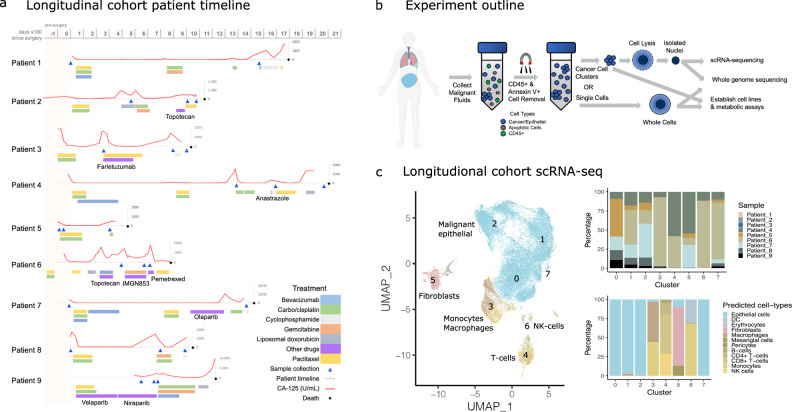
Fig. 1. Longitudinal cohort sample collection and scRNA-seq analysis.
a Timeline of patients included in the study. Gray timeline shows days ×100, with 0 referring to the day primary surgery was performed. The red lines indicate CA-125 levels, while the triangles along the timelines indicate the time points at which malignant fluid samples were obtained. Colored bars below the patient timeline indicates drug treatment received. b The malignant fluid samples were processed to remove immune and apoptotic cells, and processed for whole-genome sequencing, in vitro metabolic assays, and scRNA-seq. A portion of this figure panel was created using BioRender.com. c Uniform Manifold Approximation and Projection (UMAP) and clustering of the integrated high-quality cells profiled using iCell8 (patients 1–3) or 10X (patients 4–9) scRNA-seq platforms following CCA normalization. The numbers indicate clusters obtained following unsupervised clustering. Stacked bar plots on the right show the distribution of various predicted cell types across clusters and the diversity of samples distributed within each cluster. The colors on the UMAP indicate the cell-type classification of the single cells.

