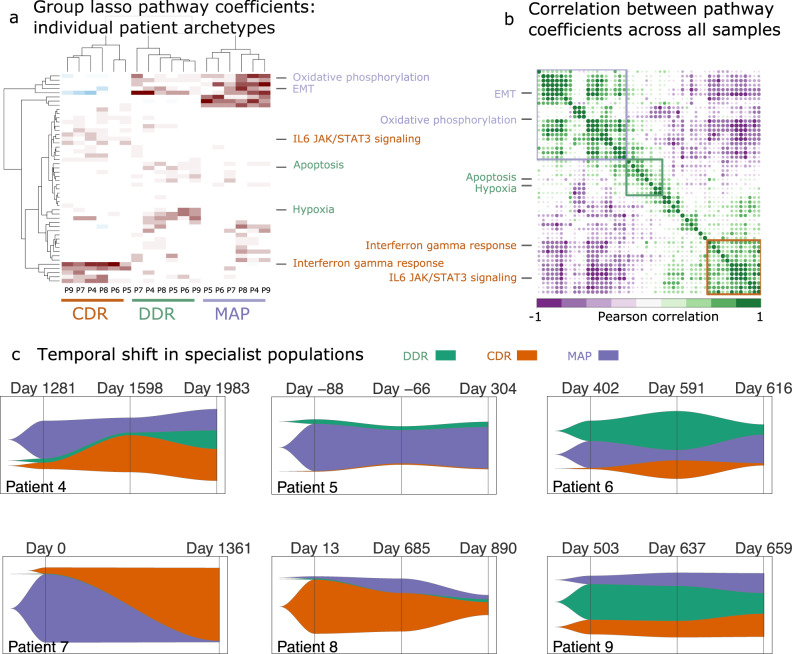
Fig. 3. Archetype evolution in individual patients.
a Hierarchical clustering of group-lasso coefficients for archetypes determined for each longitudinal cohort patient across all time points. b Correlation plot of pathway scores across all samples with three major clusters indicated using colored boxes. Key pathways that defined the biological phenotypes associated with the archetypes in the integrated dataset are shown for both the hierarchical clusters and the correlation plots. c Fishplots displaying the temporal shift in the population of task specialists for each patient. The three major tasks are represented with their respected abbreviations (DDR DNA-damage repair, MAP metabolism and proliferation, and CDR cell defense response).

