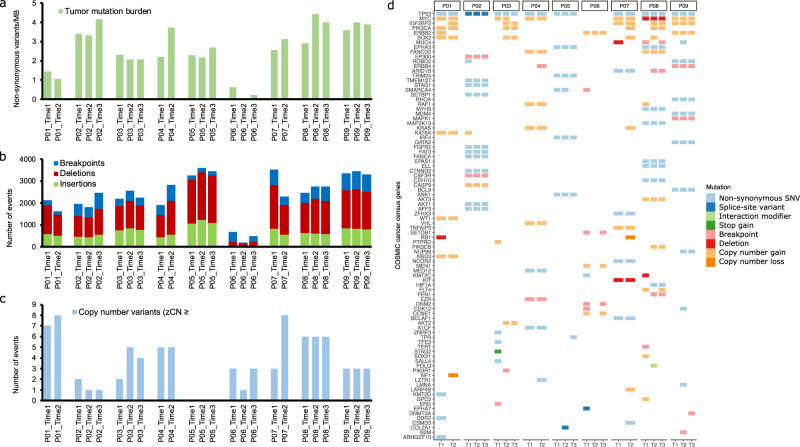
Fig. 5. Overview of somatic WGS variants in the longitudinal cohort.
a Tumor mutation burden (non-synonymous SNVs and small indels/MB) in the longitudinal cohort samples. b Stacked bar plots showing the frequency of SVs, including indels (>25 bp) and breakpoints in each sample. c The number of genes with copy number alterations in each sample. The plot displays the number of genes that show a z-transformed copy number ≥2 (gain) or ≤−2 (loss). d Oncoprint displaying somatic variants affecting COSMIC cancer census genes. The plot displays SNVs and small indels with VAF > 0.05, large indels and breakpoints affecting exons, and CNVs with z-transformed copy number ≥2 (gain) or ≤−2 (loss).

